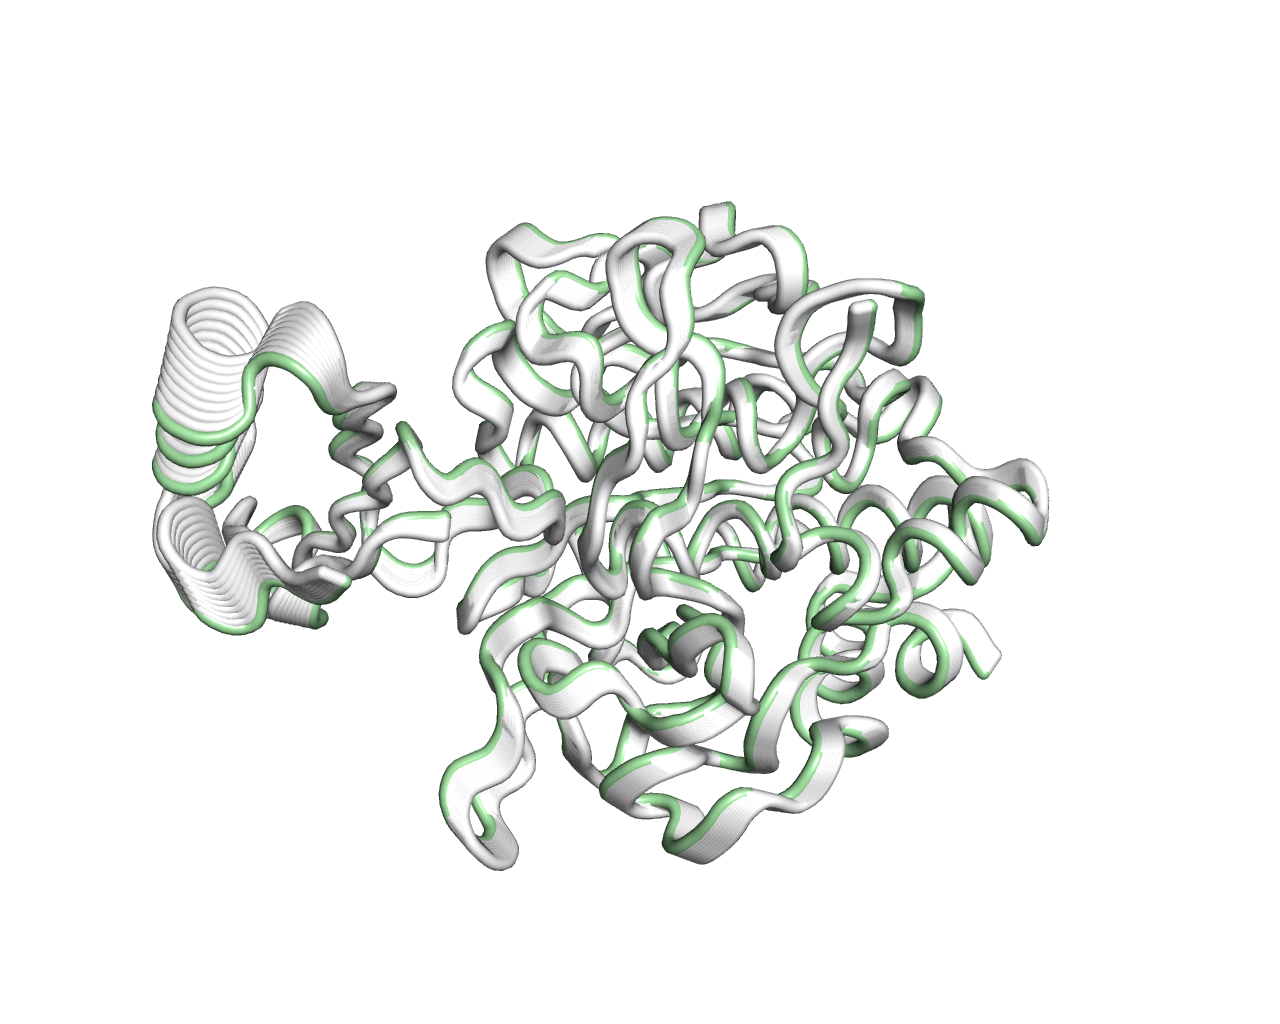
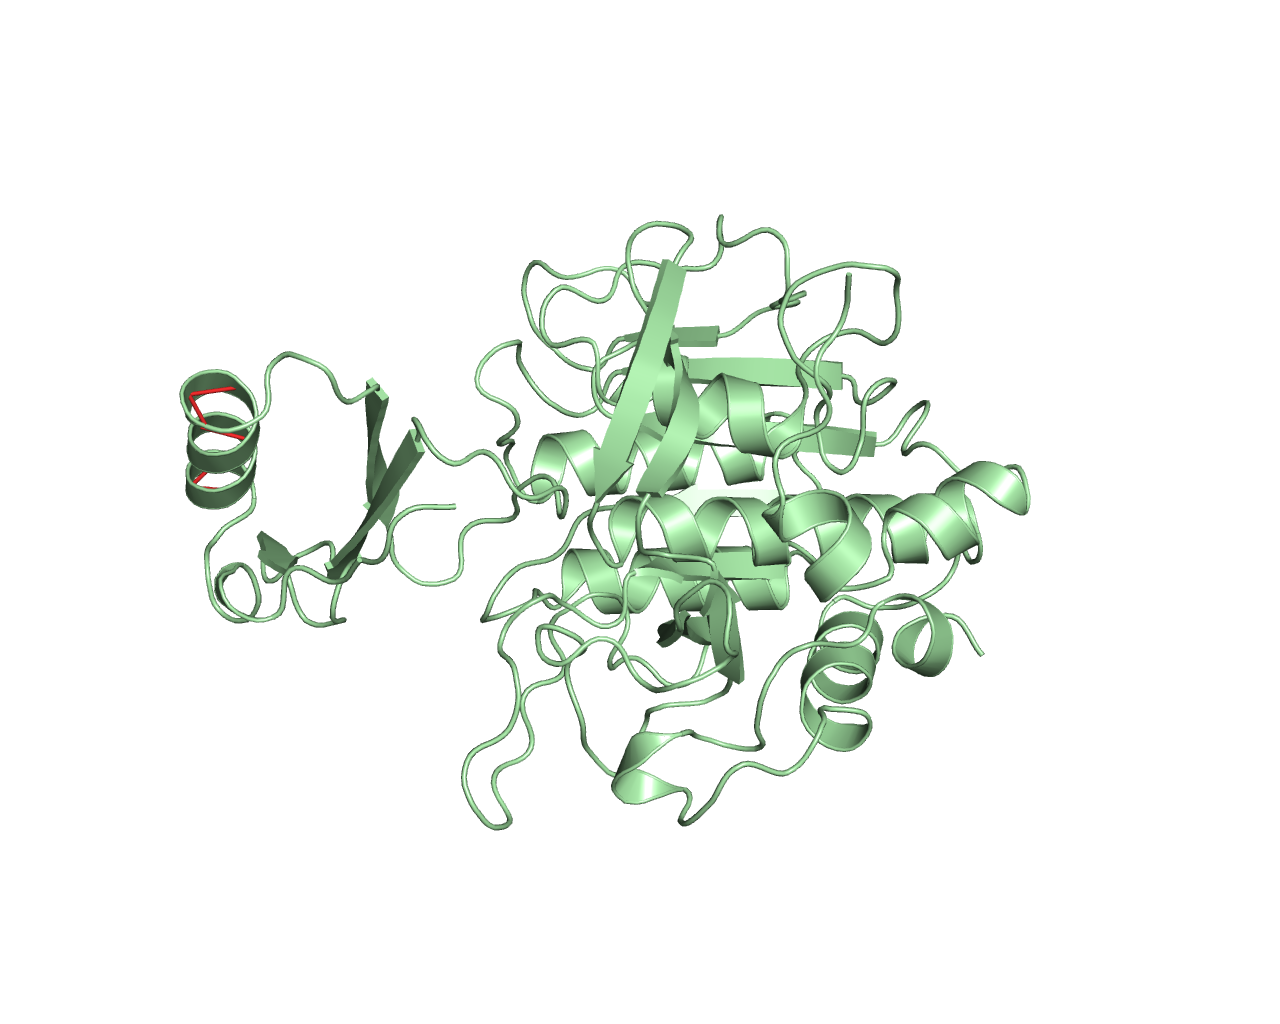
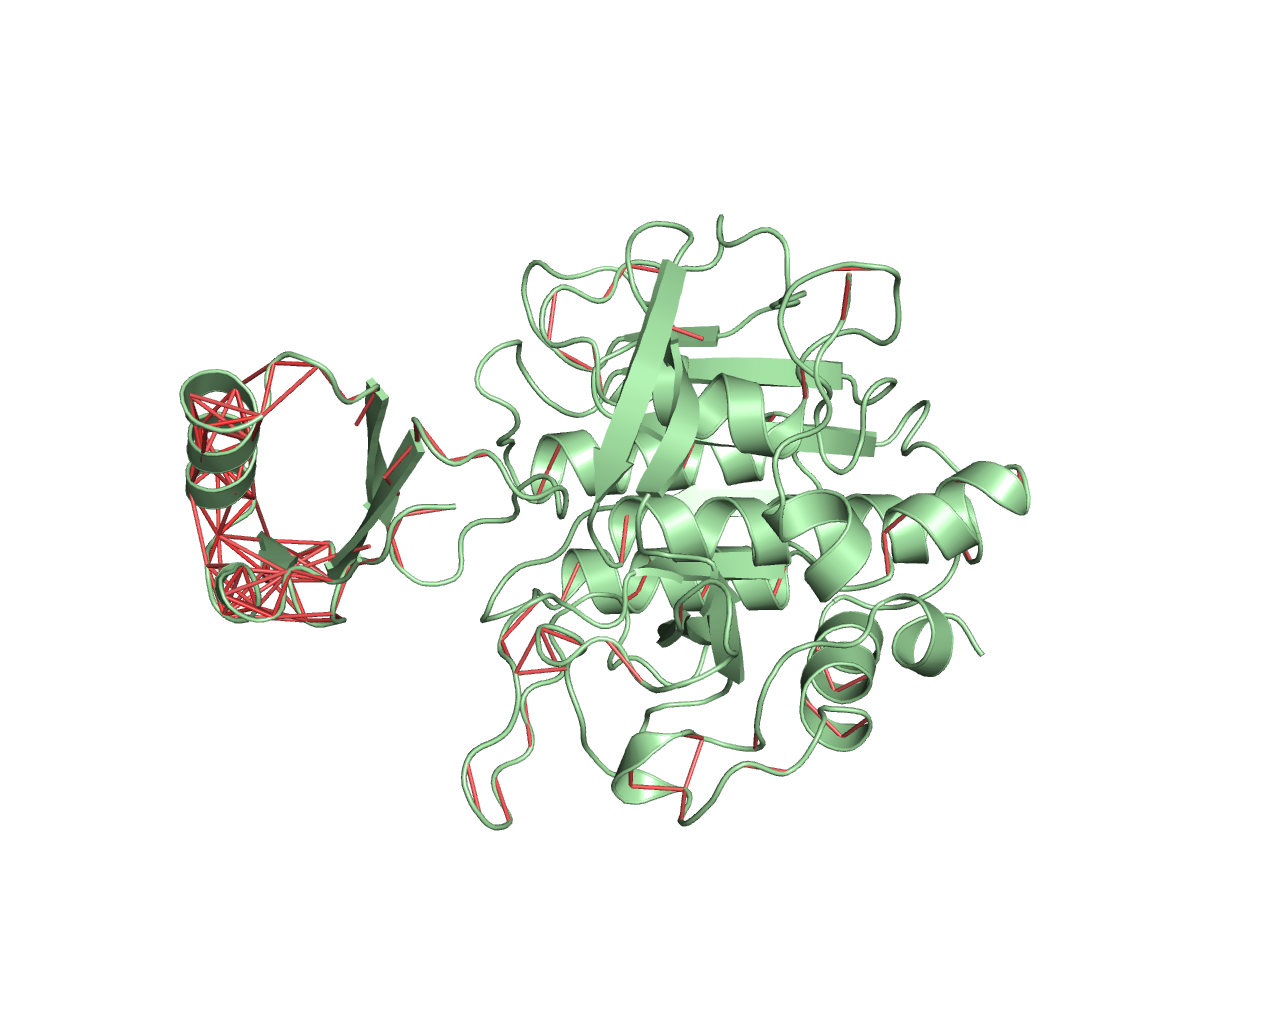
Trajectory representation for the first non-trivial mode of the molecule motion based on Normal Mode Analysis.
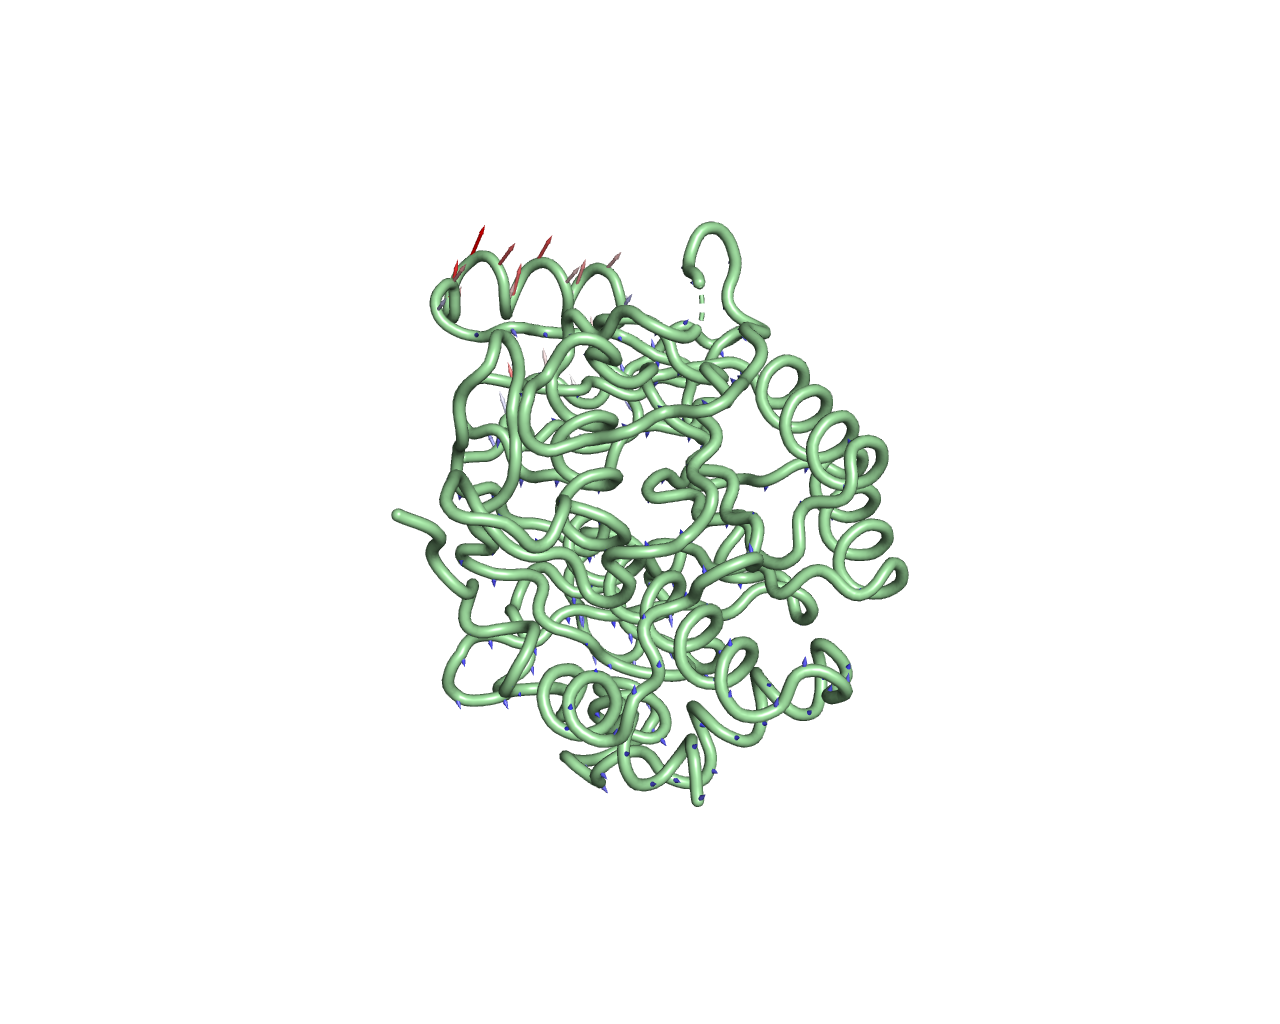
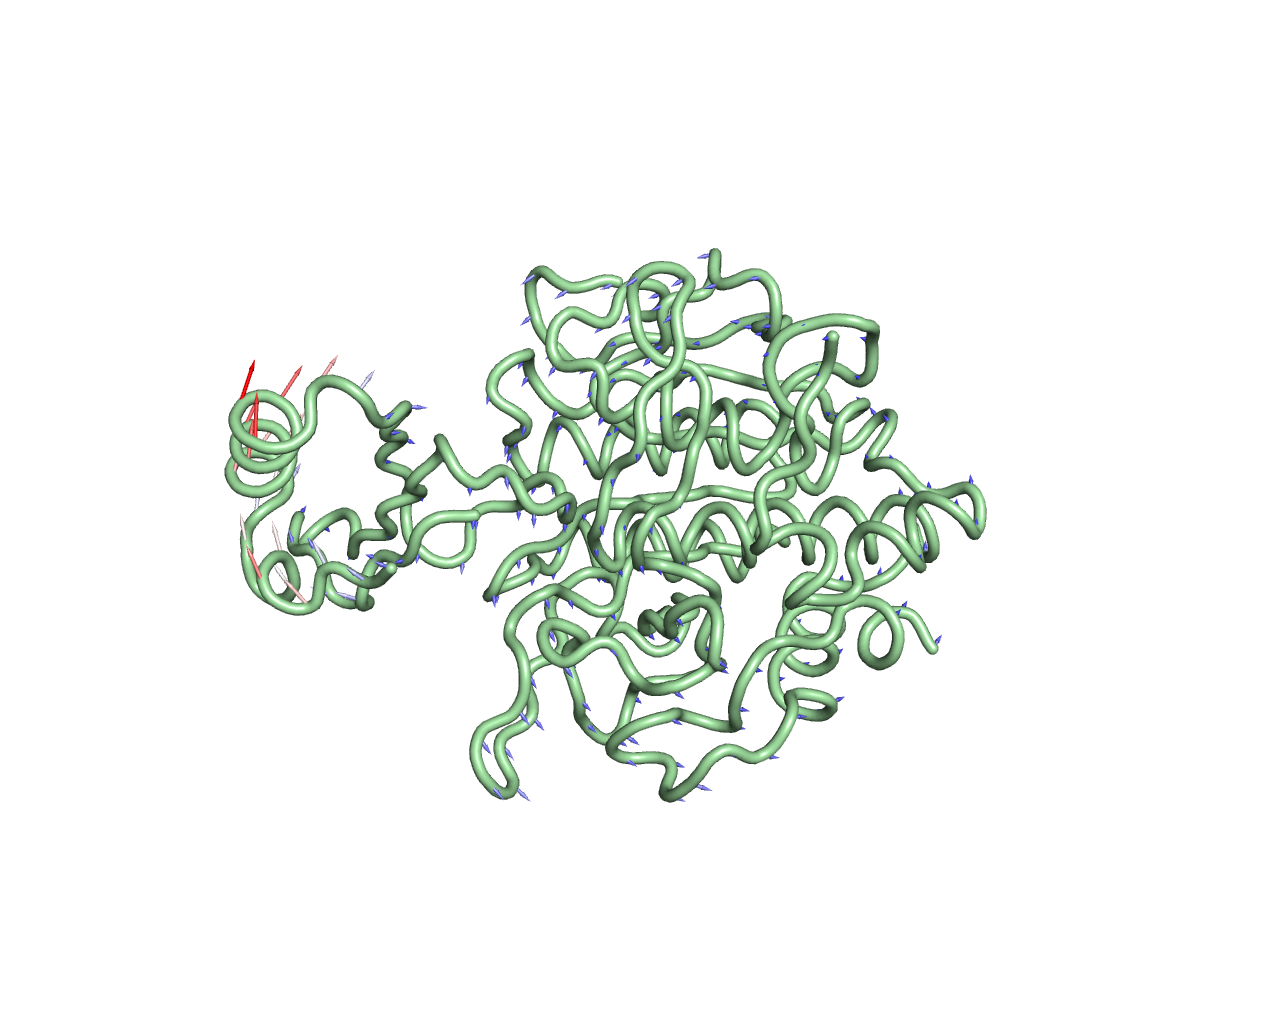
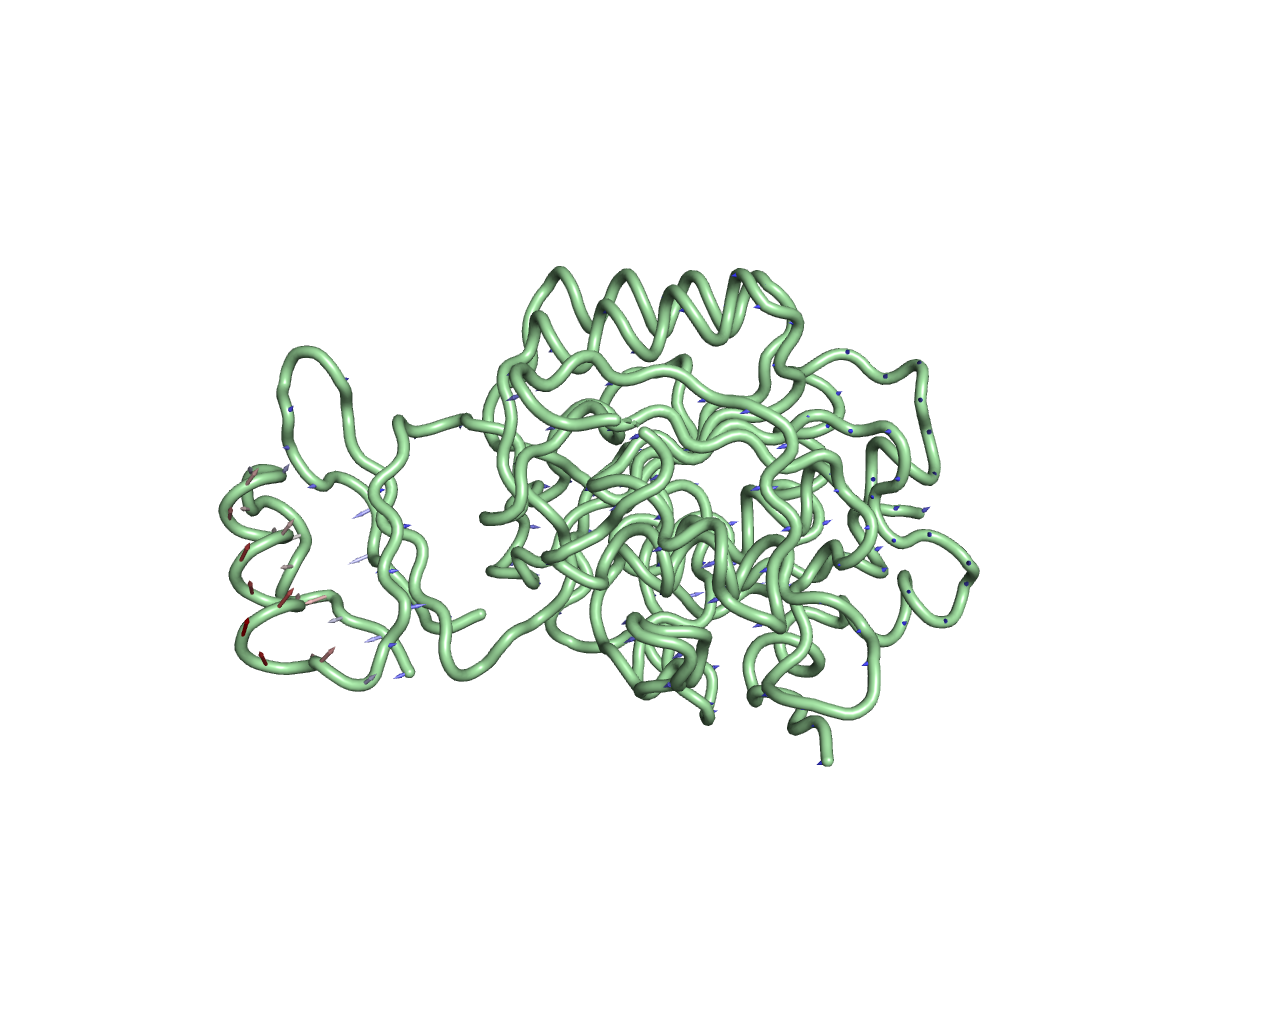


                                            Porcupine plots
                                        
                                        
                                    Vector field representation of molecule for the first non-trivial mode of the molecule motion based on Normal Mode Analysis.


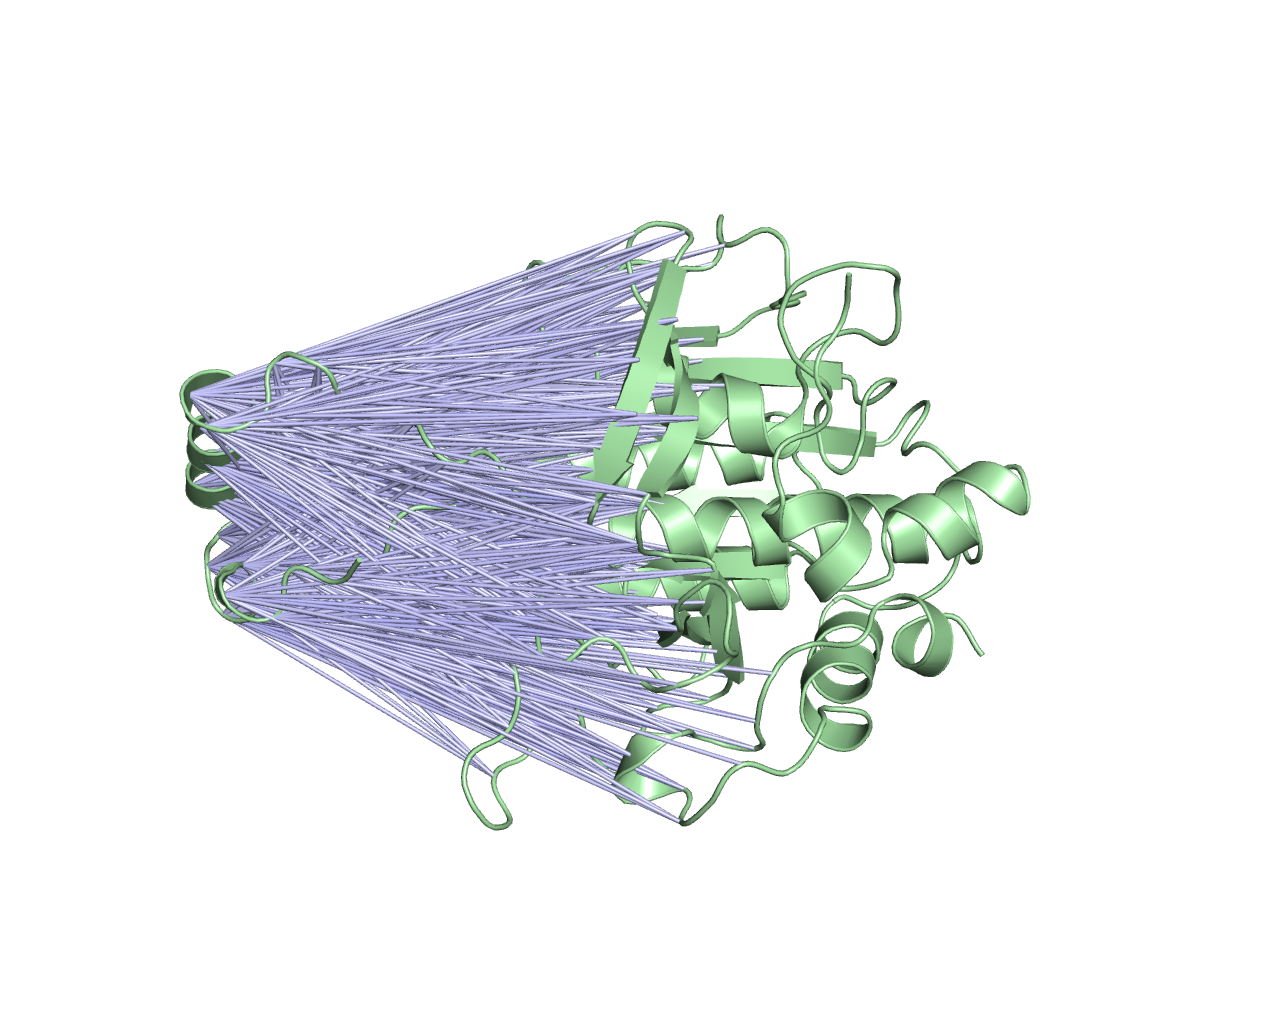
                                    Dynamical Cross-Correlation Map (DCCM)


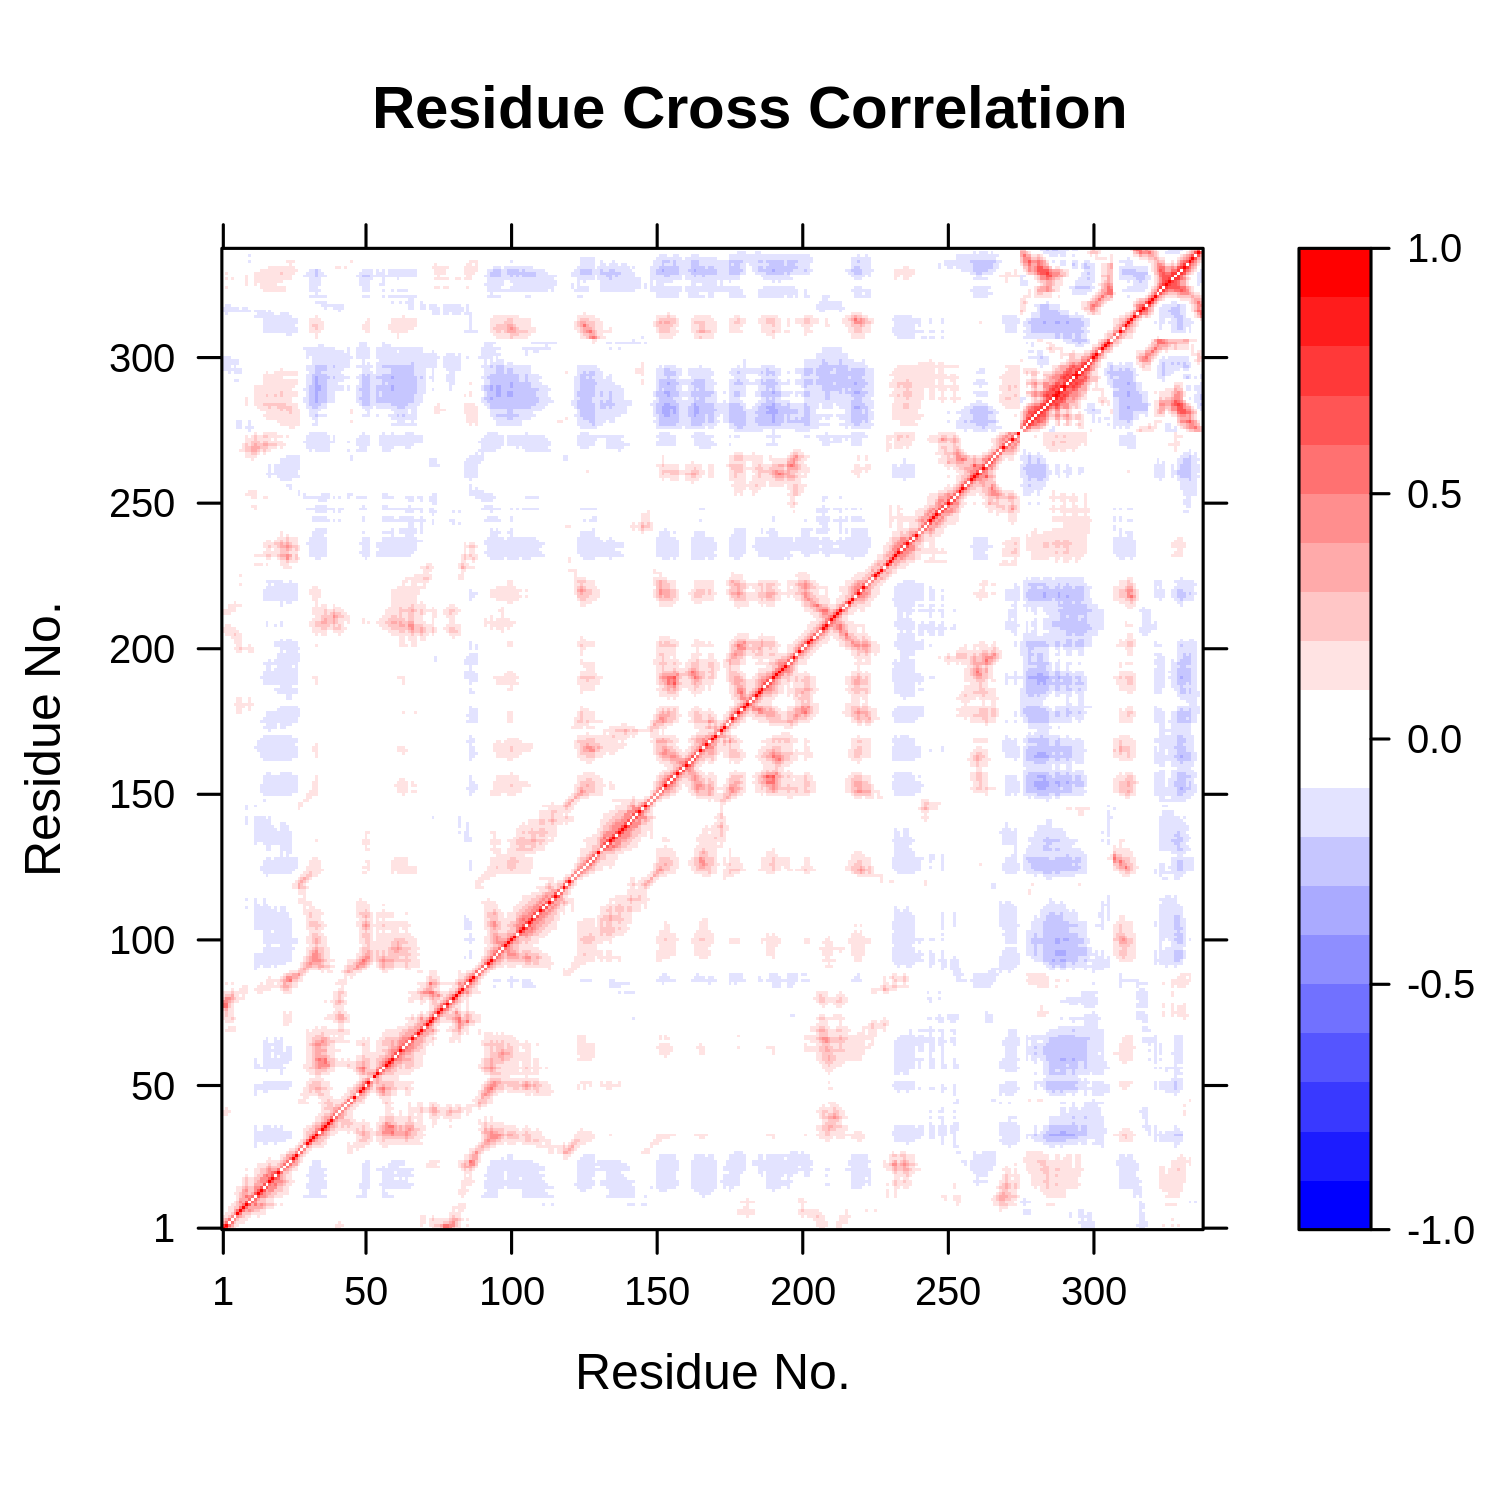
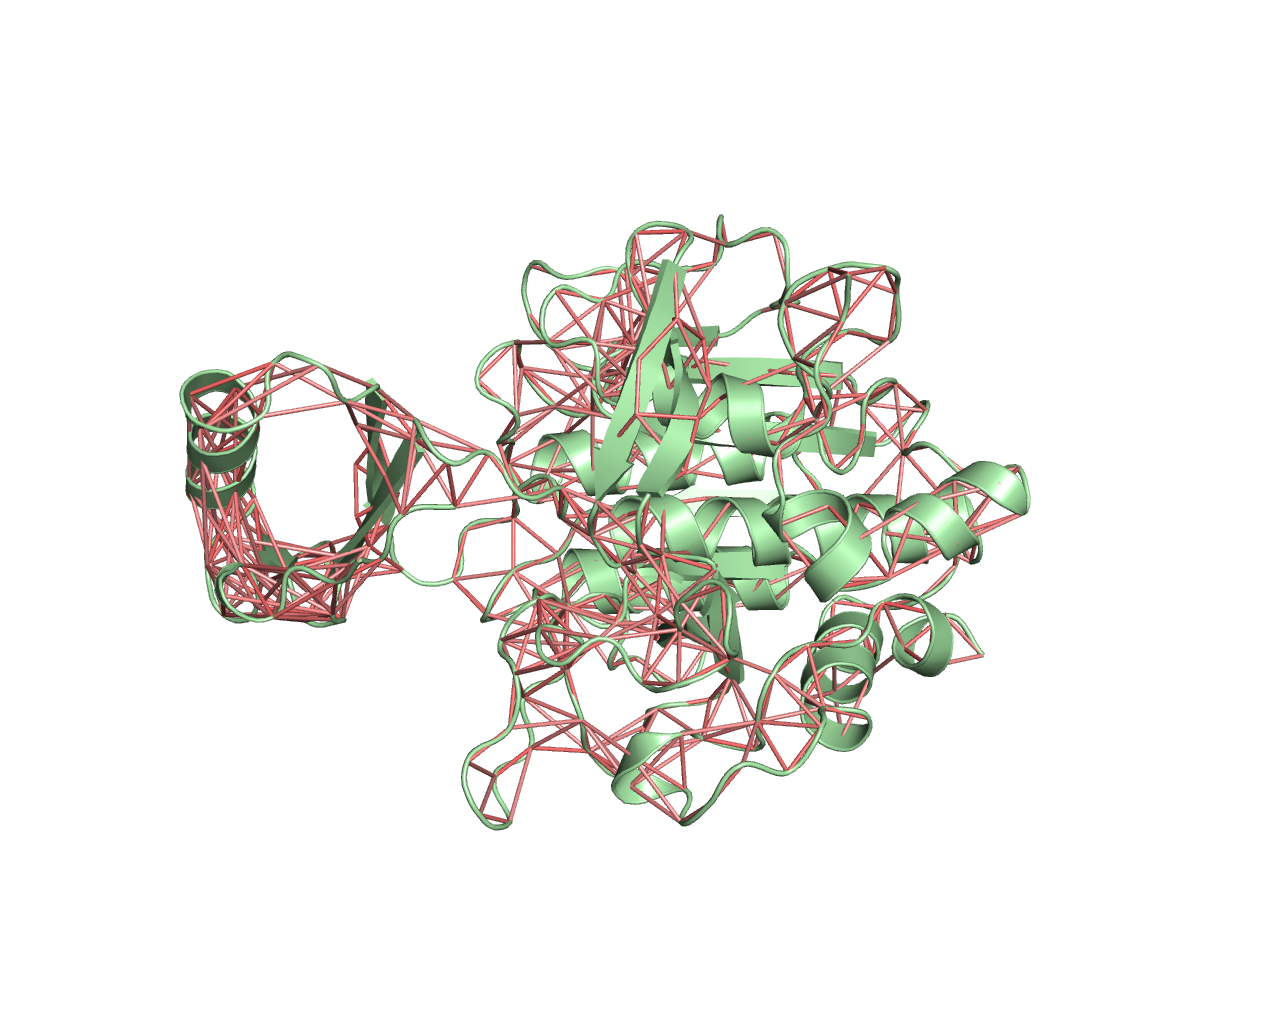
                            All modes were used to calculated the residue cross-correlation.
Correlation map revealing correlated (red) and anti-correlated (blue) regions in the protein structure.
Assuming: Cab = Correlation between residues a and b
If Cab = 1 the fluctuations of residues a and b are completely correlated (same period and same phase), if Cab = -1 the fluctuations of residues a and b are completely anticorrelated (same period and opposite phase), and if Cab = 0 the fluctuations of a and b are not correlated.
 
                                        
                                            Correlated Residues


                                            Anti-correlated Residues
                                        
                                     
                                        