DynaMut - Prediction Outcomes
Submission details
Wild-type: GLU
Position: 346
Mutant: LYS
Chain: A
Prediction Outcome
ΔΔG: -0.457 kcal/mol (Destabilizing)
NMA Based Predictions
ΔΔG ENCoM: -0.139 kcal/mol (Destabilizing)
Other Structure-Based Predictions
ΔΔG mCSM: -0.371 kcal/mol (Destabilizing)
ΔΔG SDM: -0.160 kcal/mol (Destabilizing)
ΔΔG DUET: -0.203 kcal/mol (Destabilizing)
Δ Vibrational Entropy Energy Between Wild-Type and Mutant
ΔΔSVib ENCoM: 0.174 kcal.mol-1.K-1 (Increase of molecule flexibility)
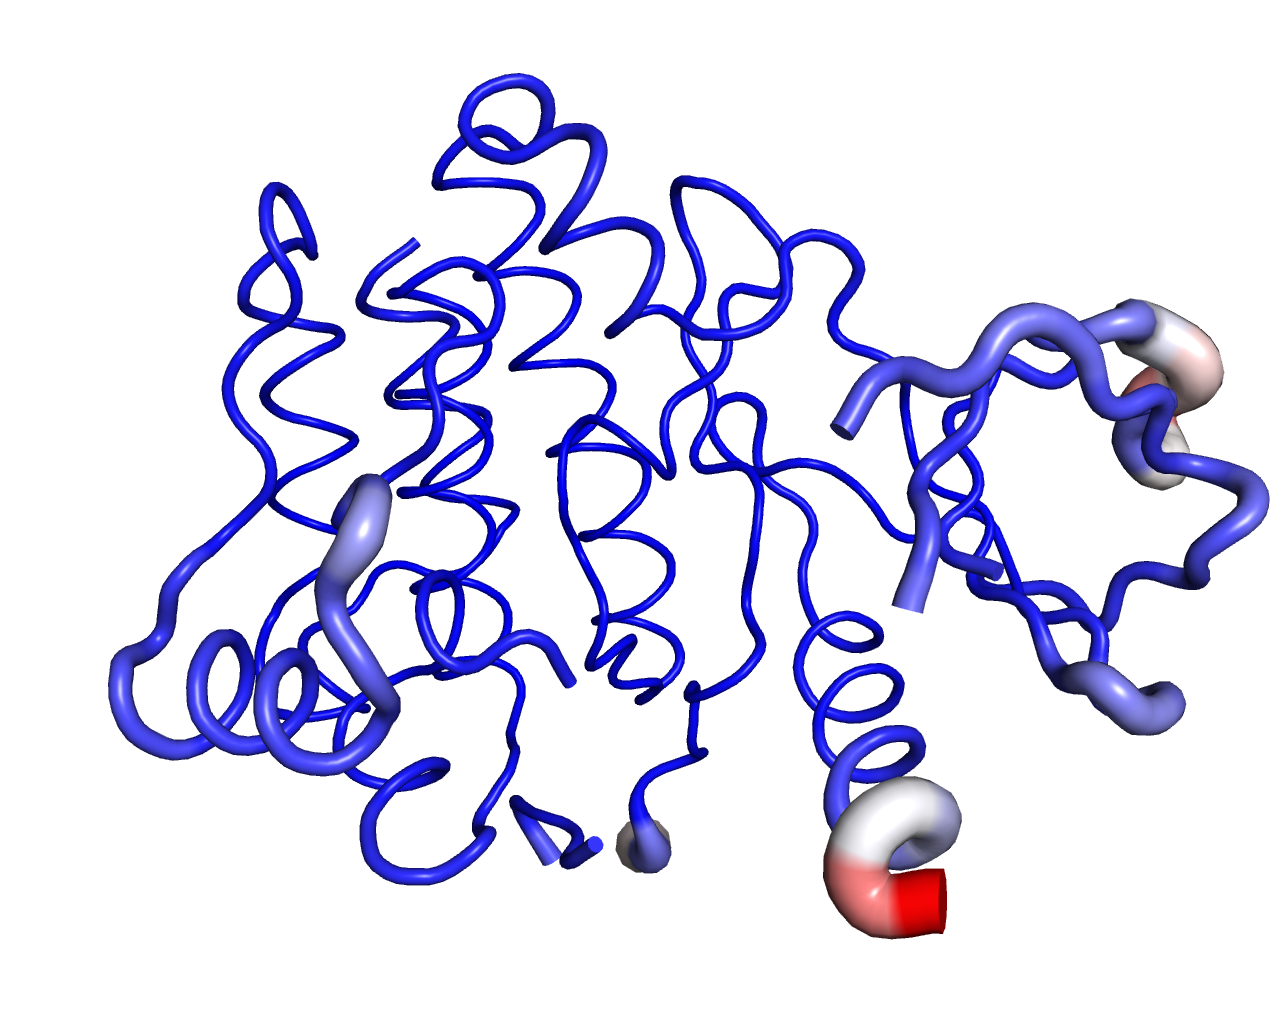
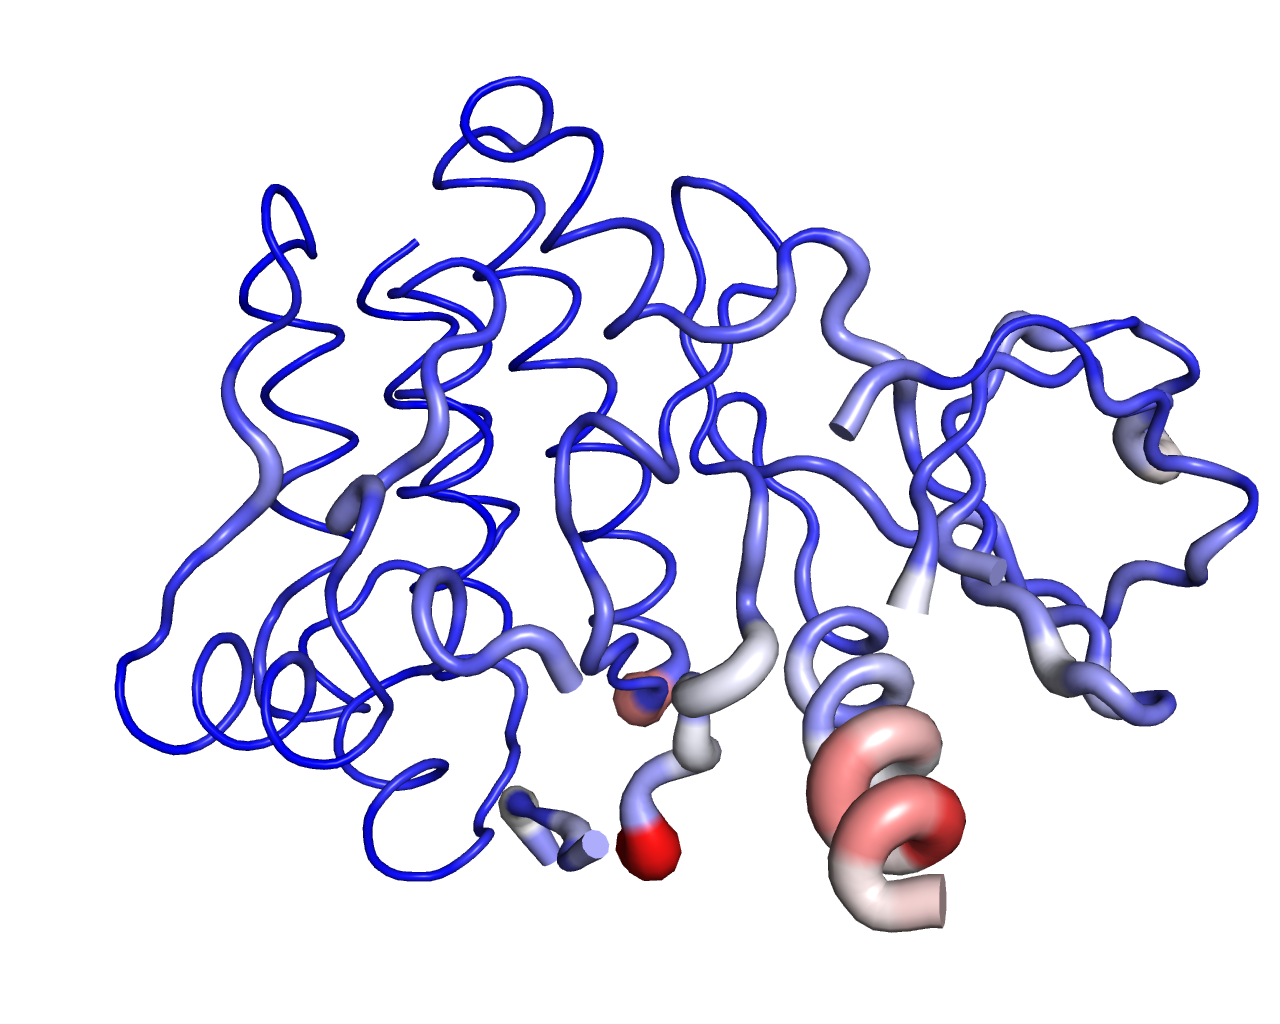
Δ Vibrational Entropy Energy | Visual representation
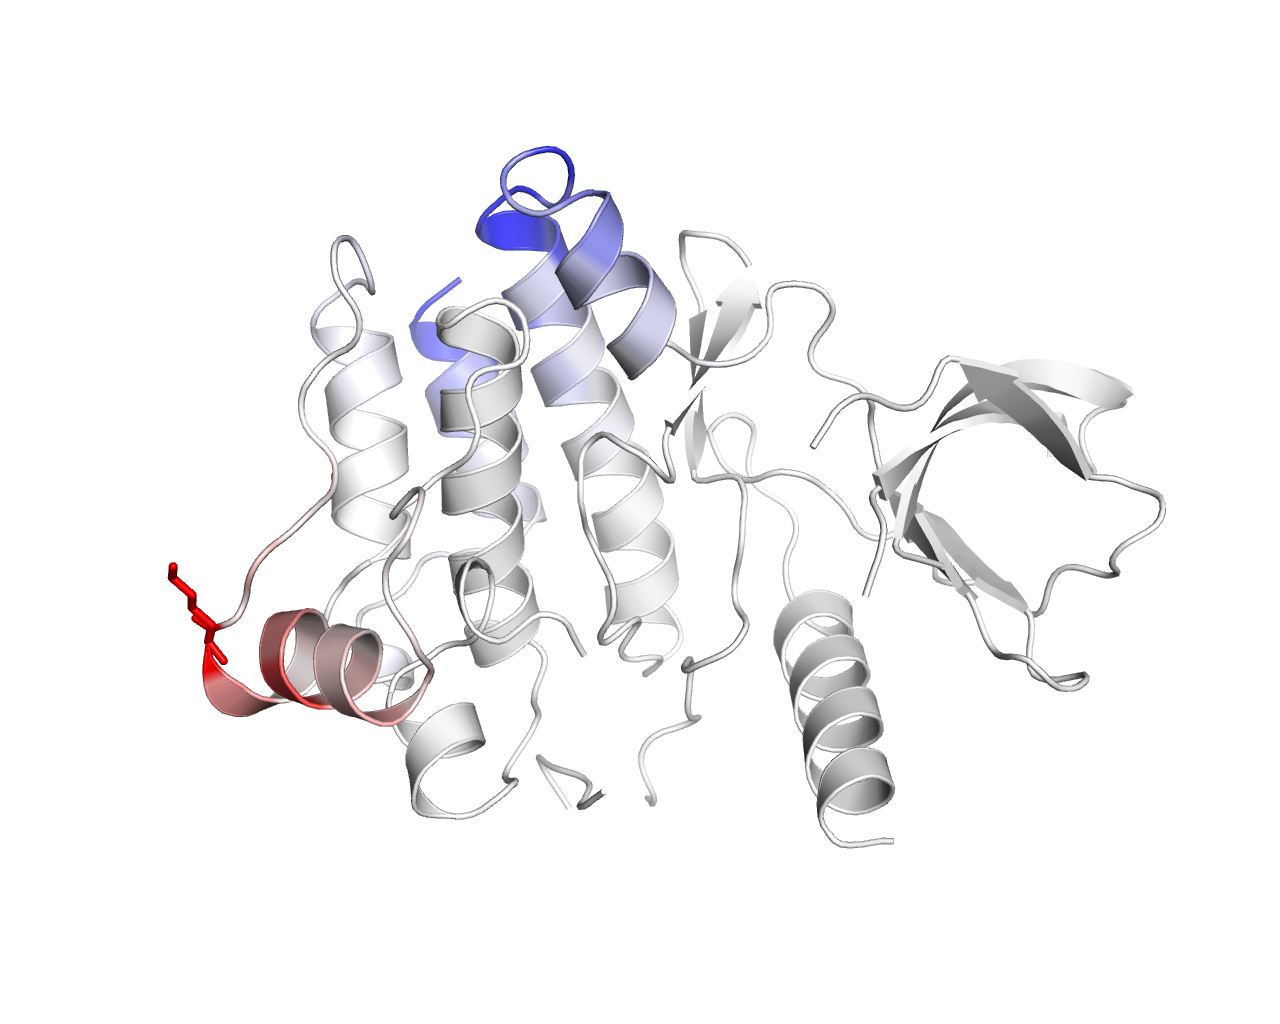
Amino acids colored according to the vibrational entropy change upon mutation. BLUE represents a rigidification of the structure and RED a gain in flexibility
Download Resources
Pymol Sessions
Δ Flexibility AnalysisHigh Resolution Images
Δ Flexibility AnalysisPrediction of Interactomic Interactions
| Bond Type | Color |
|---|---|
| Hydrogen bonds | |
| Water mediated hydrogen bonds | |
| Weak hydrogen bonds | |
| Water mediated weak hydrogen bonds | |
| Halogen bonds | |
| Ionic interactions | |
| Metal complex interactions | |
| Aromatic contacts | |
| Hydrophobic contacts | |
| Carbonyl contacts |
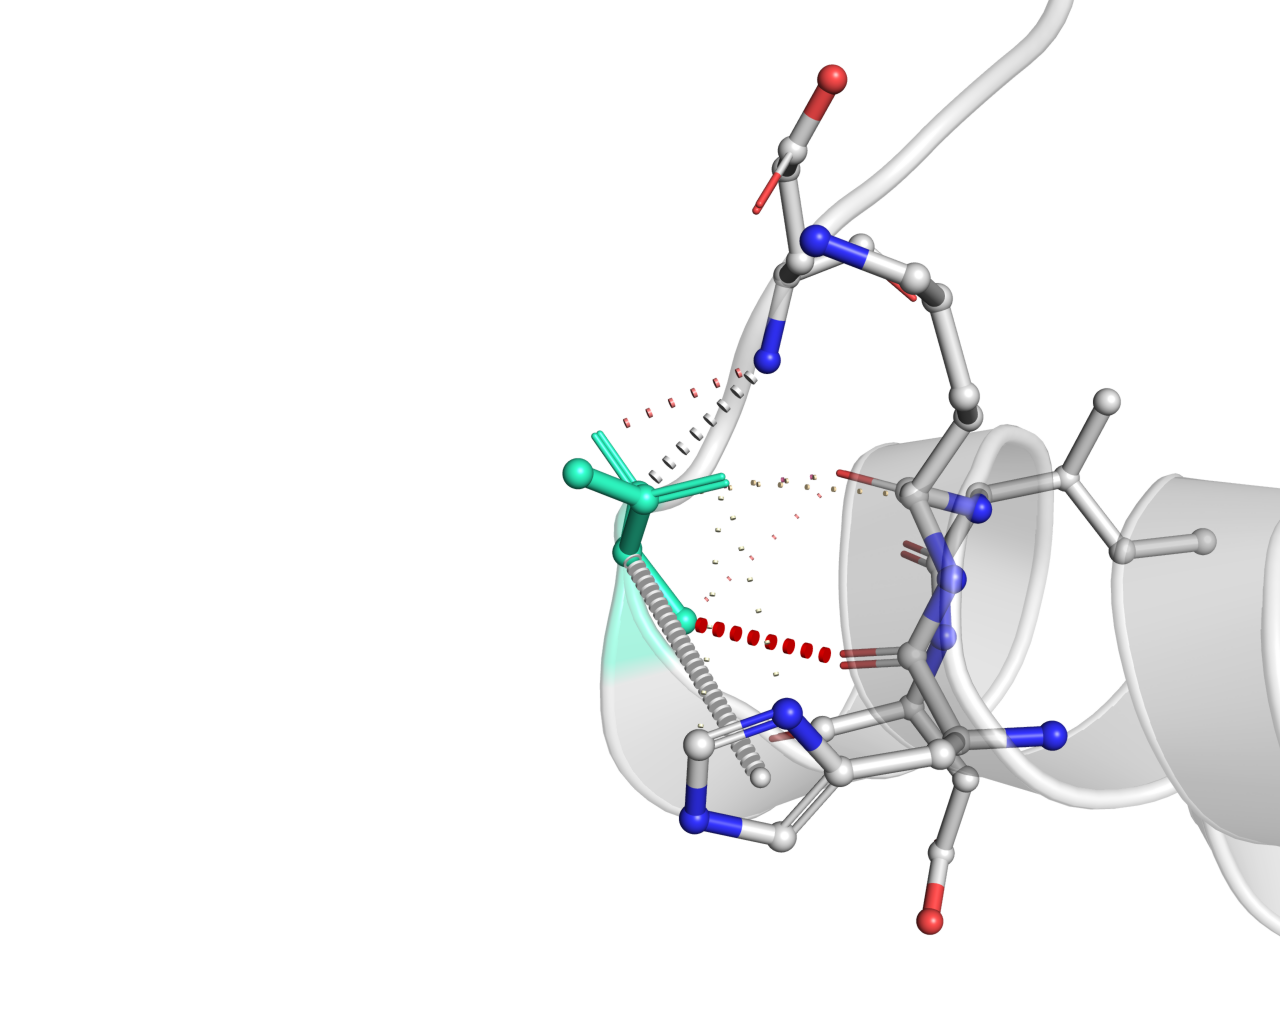
Wild-type
Mutant
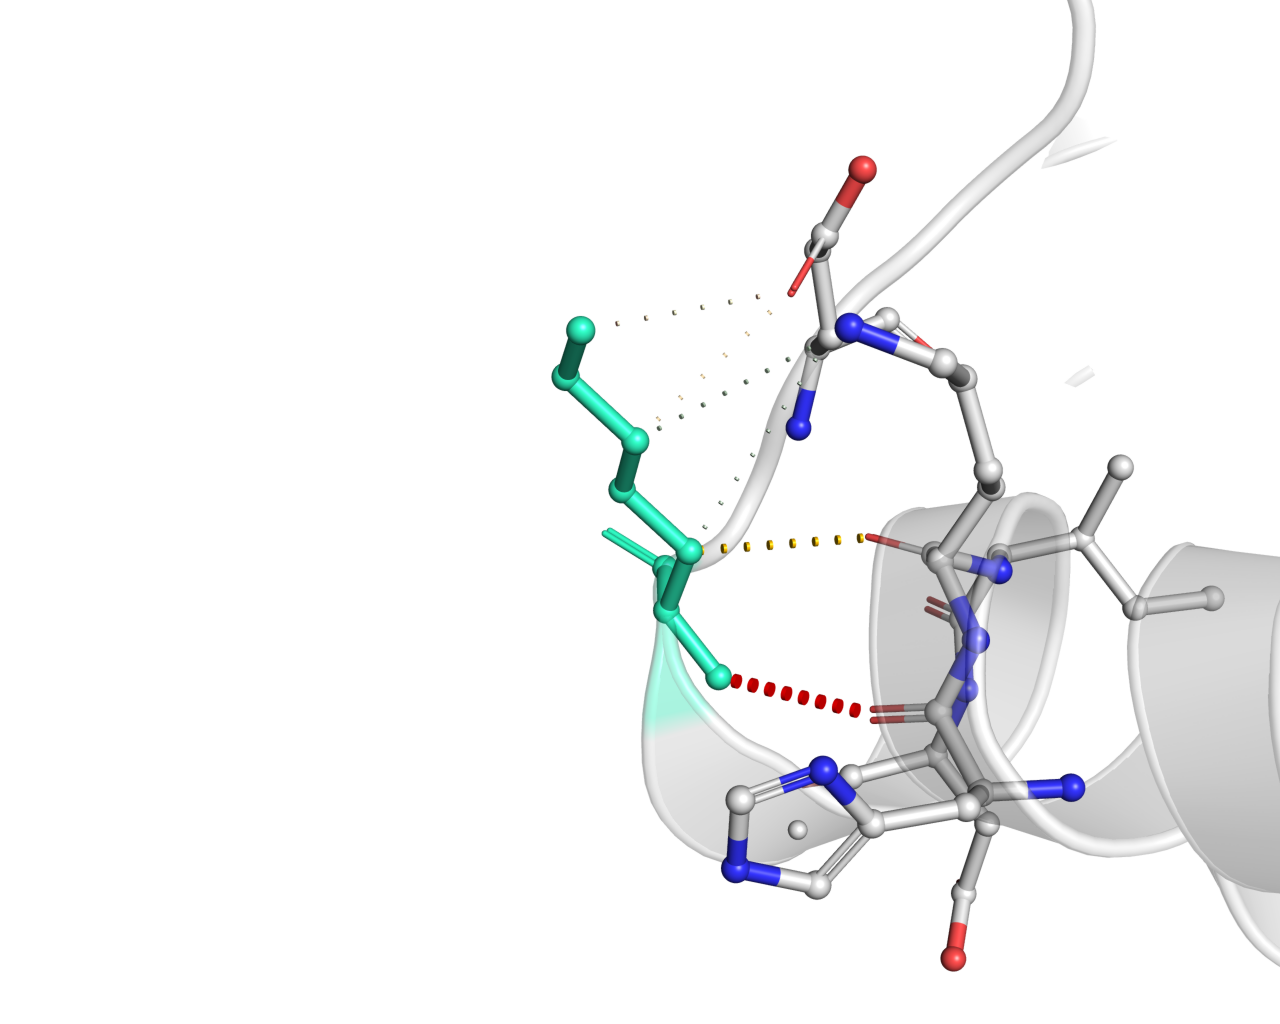
Wild-type and mutant residues are colored in light-green and are also represented as sticks alongside with the surrounding residues which are involved on any type of interactions.
Download Resources
PDB Structures
MutantEnsemble NMA of Wild-type and Mutant
Wild-type and Mutant sequence were extracted from their respective 3D structures and then aligned. The results of normal mode data for each of the sequences are displayed below.
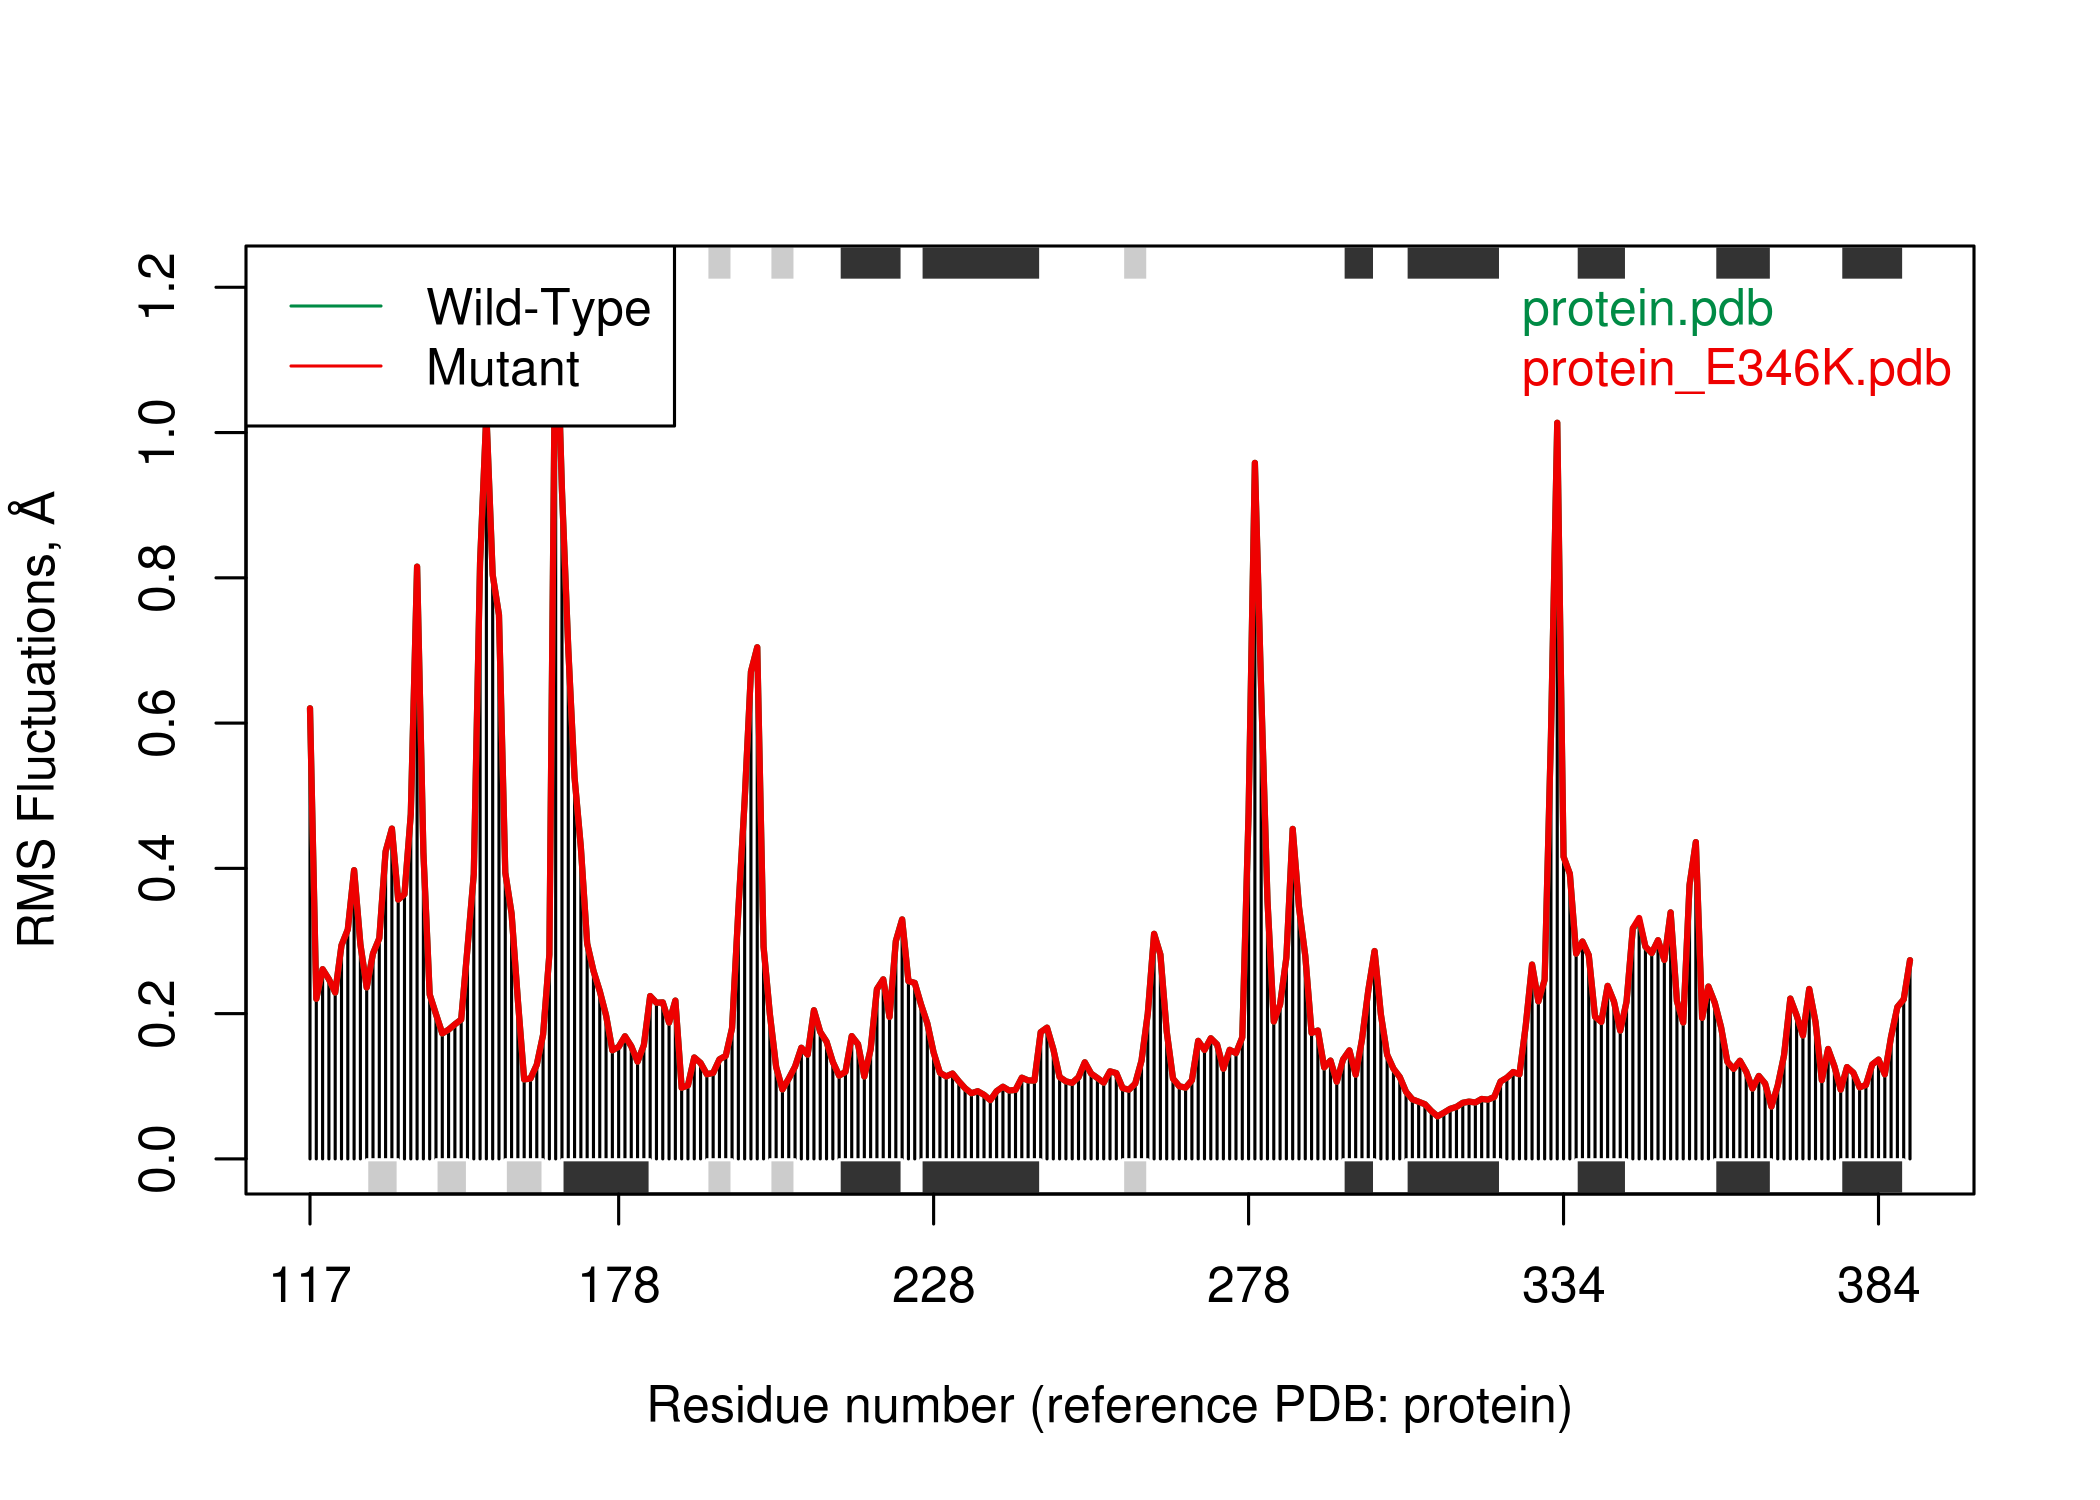
Type of secondary structure on each region of the sequence is added to the top and bottom margins of the plot (helices black and strands gray)
Visual analysis of Atomic Fluctuation
Atomic Fluctuation provides the amplitude of the absolute atomic motion.
Calculations performed over the first 10 non-trivial modes of the molecule.
Wild-type
Mutant

The magnitute of the fluctuation is represented by thin to thick tube colored blue (low), white (moderate) and red (high).
Visual analysis of Deformation Energies
Deformation energy provides a measure for the amount of local flexibility in the protein.
Calculations performed over the first 10 non-trivial modes of the molecule.
Wild-type

Mutant
The magnitute of the deformation is represented by thin to thick tube colored blue (low), white (moderate) and red (high).