DynaMut - Results Normal Mode Analysis
Submission details
PDB Structure: 1u46
Force Field: C-Alpha
Analysis
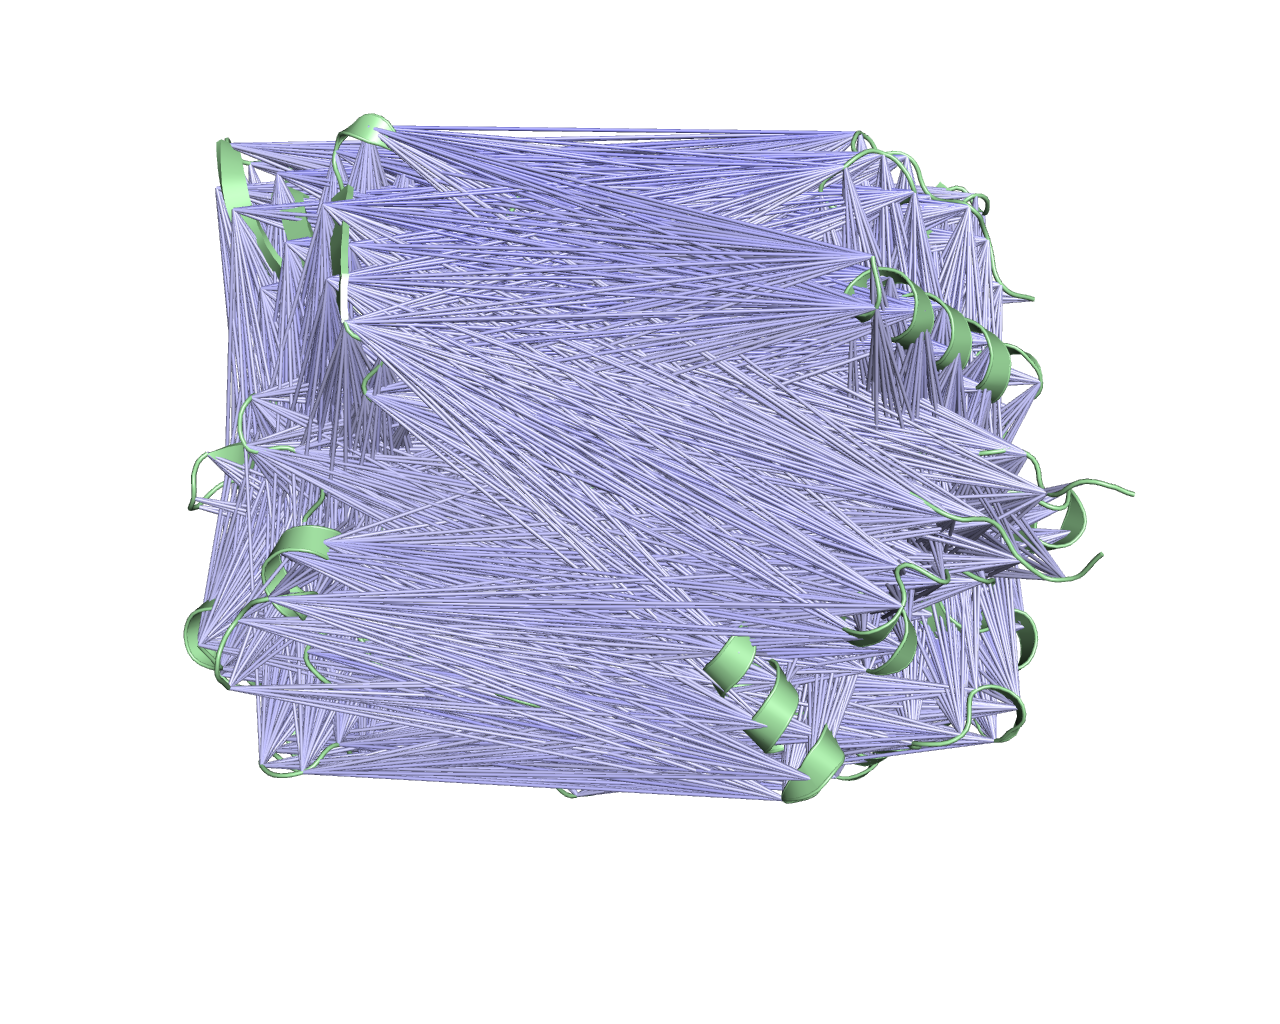
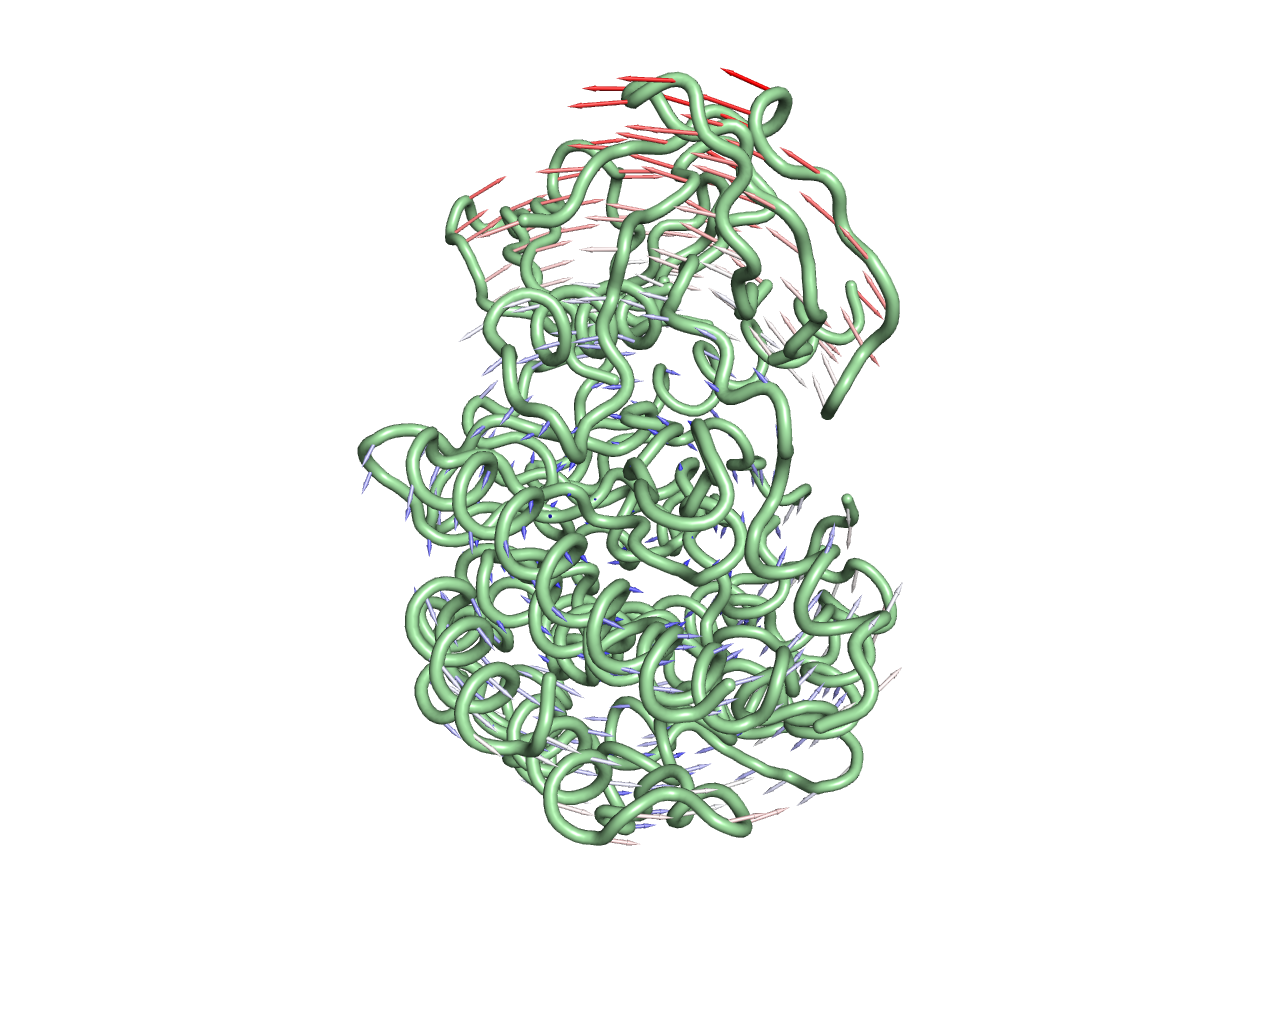
Vector field representation of molecule for the first non-trivial mode of the molecule motion based on Normal Mode Analysis.
Download Resources
Pymol session
Pymol sessionAnalysis
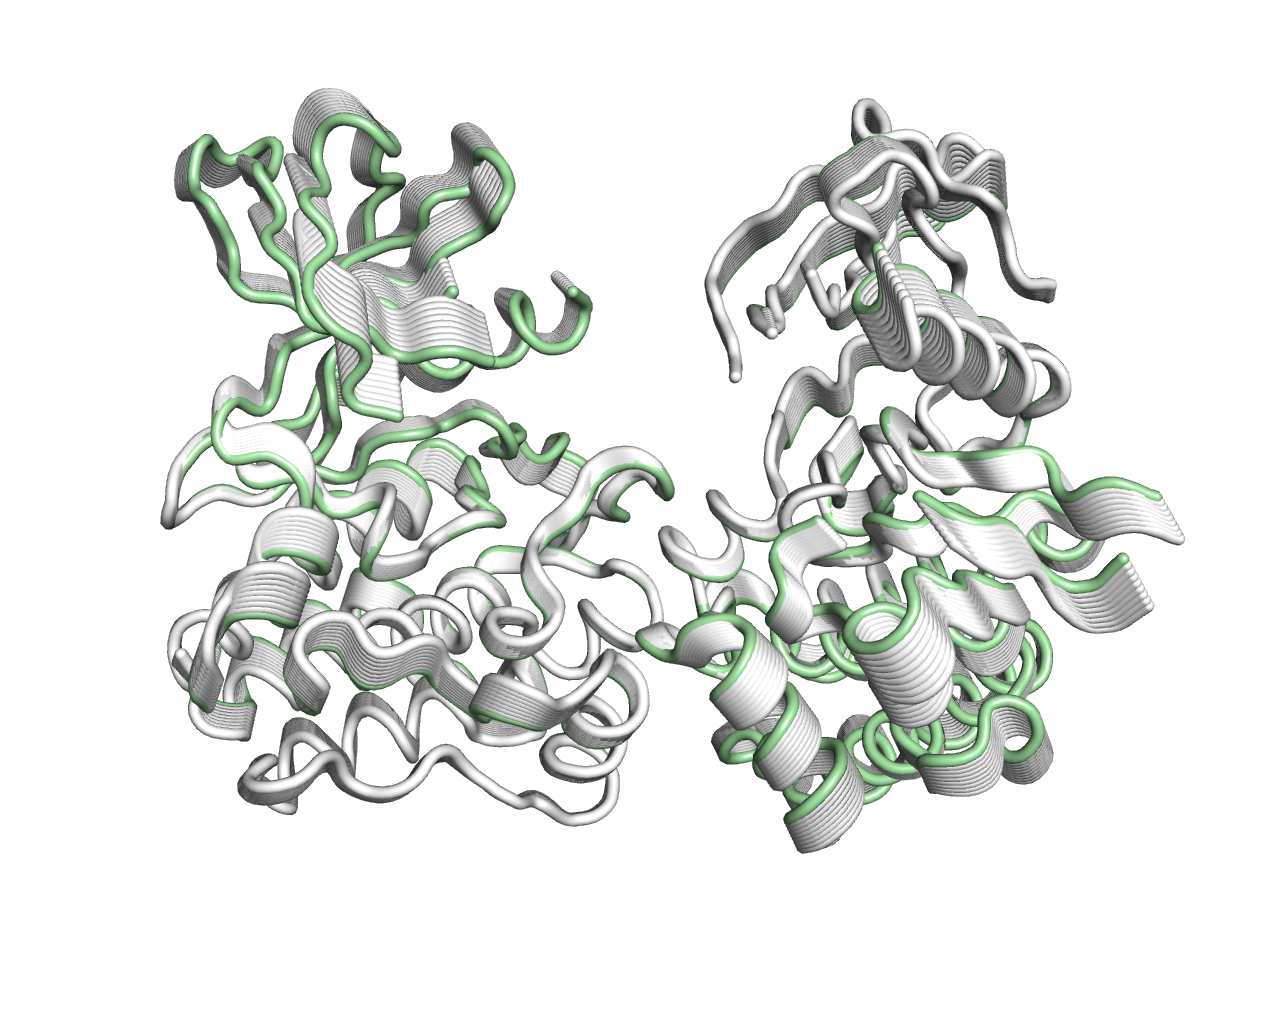
Trajectory representation for the first non-trivial mode of the molecule motion based on Normal Mode Analysis.

Download Resources
Visual Analysis
Calculations performed over the first 10 non-trivial modes of the molecule.
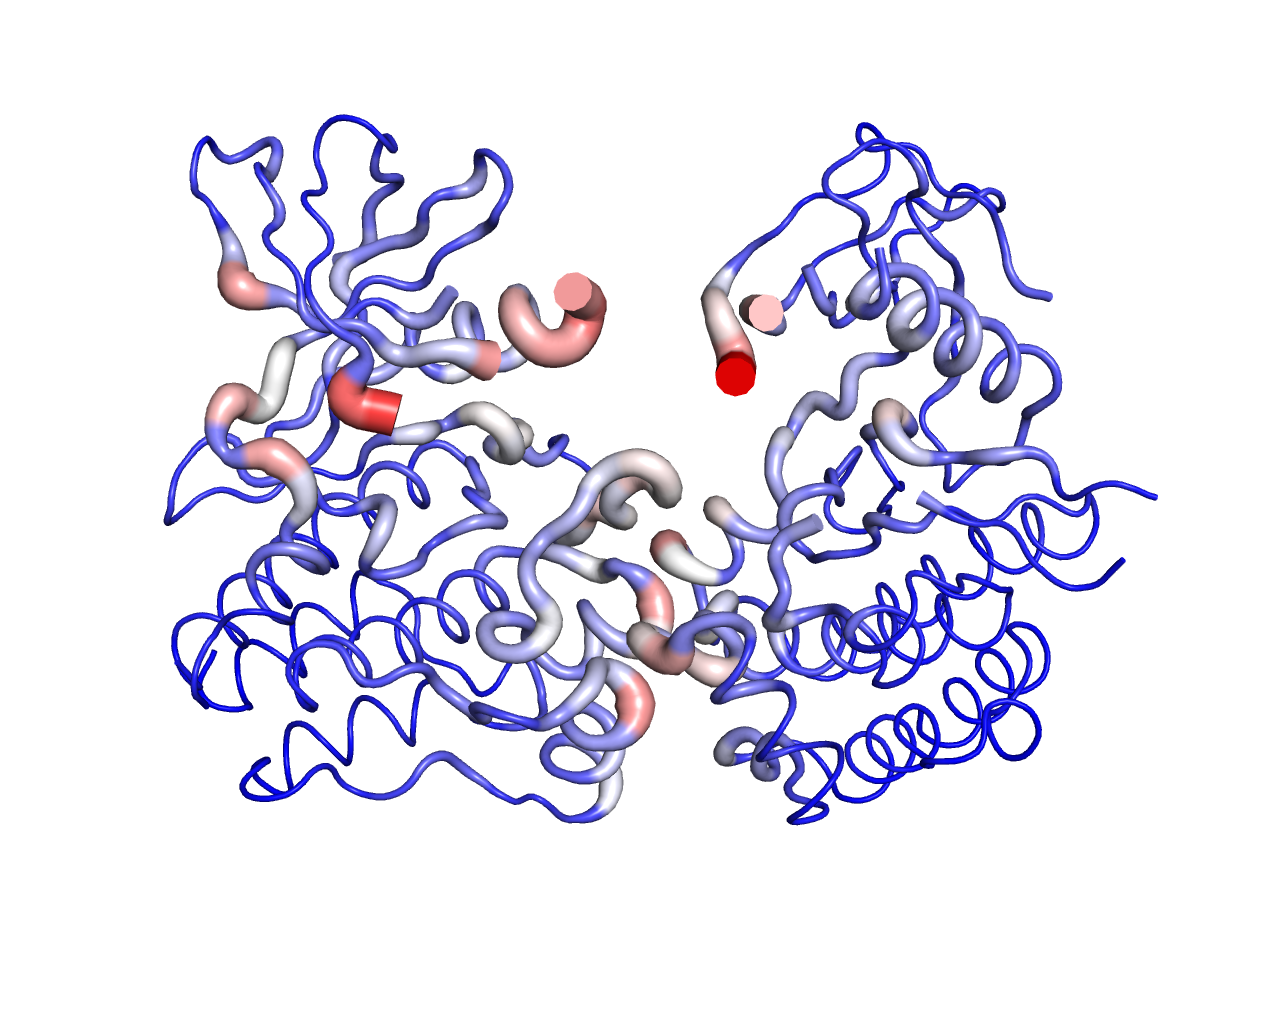
Deformation Energy provides a measure for the amount of local flexibility in the protein.
Atomic Fluctuation provides the amplitude of the absolute atomic motion.
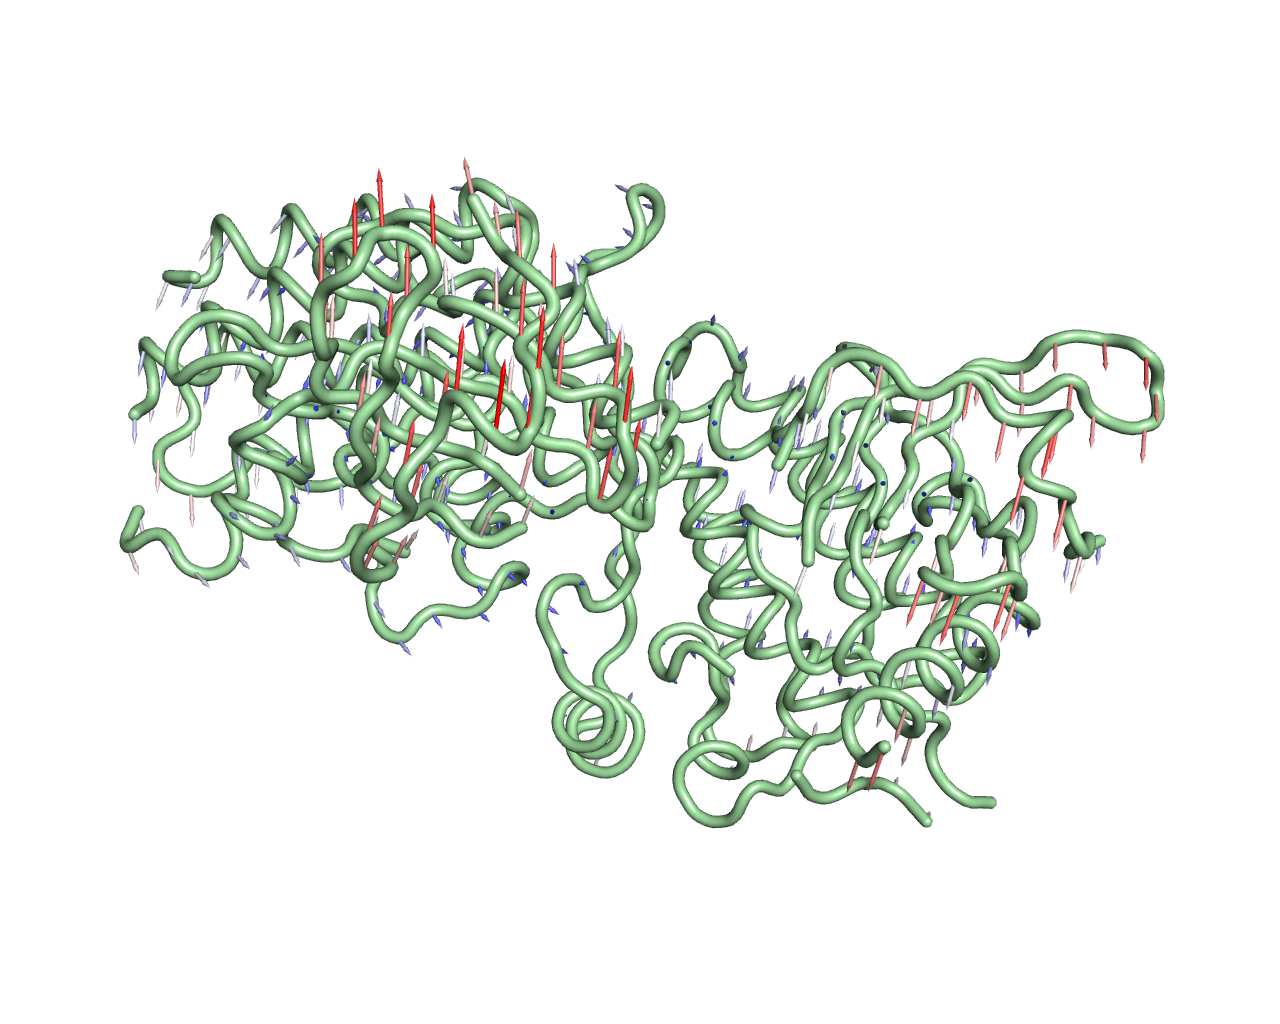
Deformation Energies
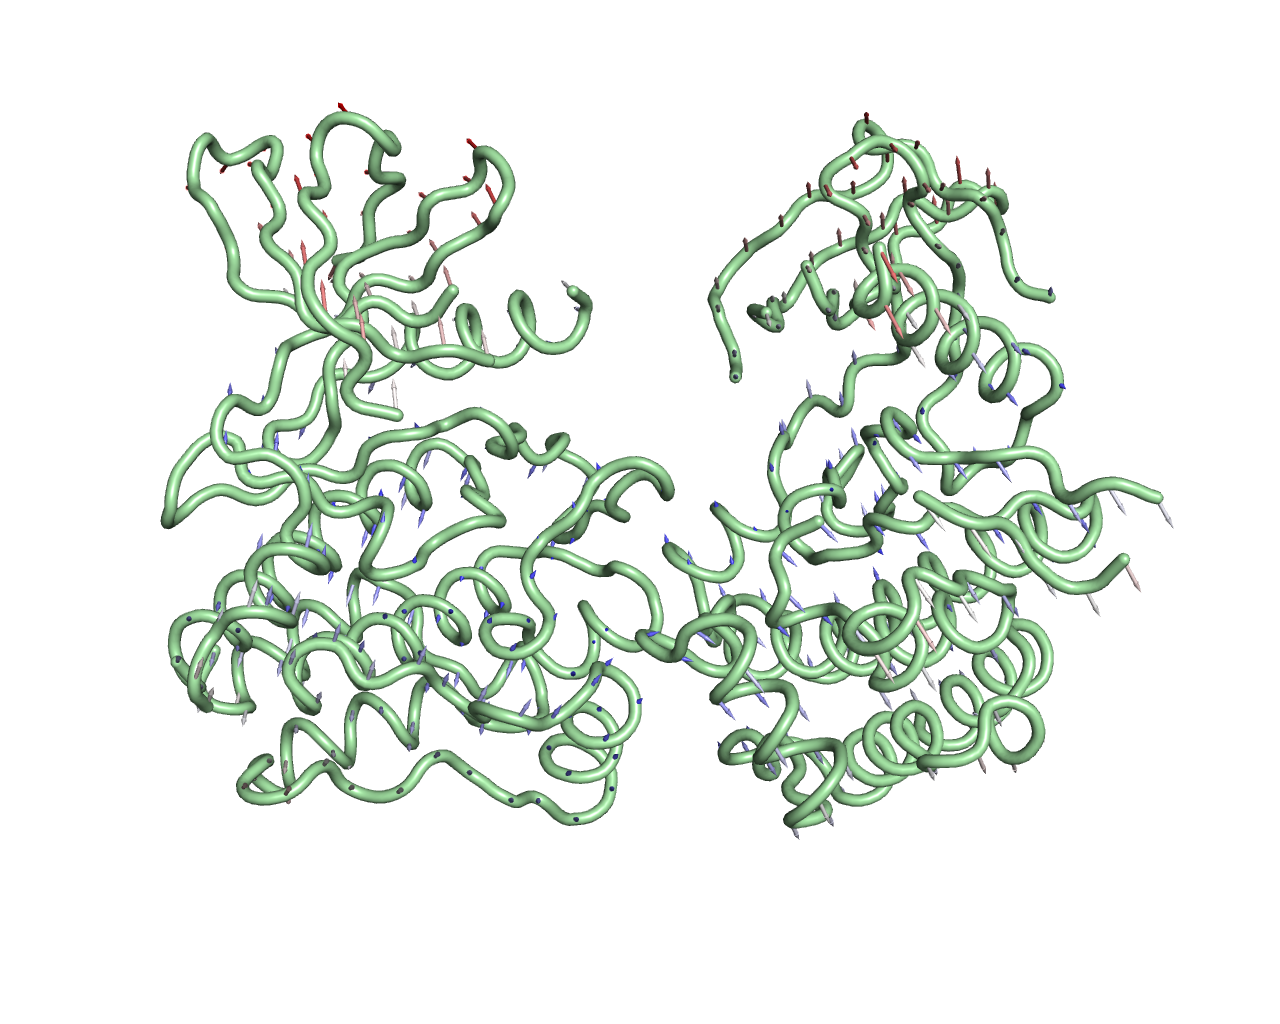
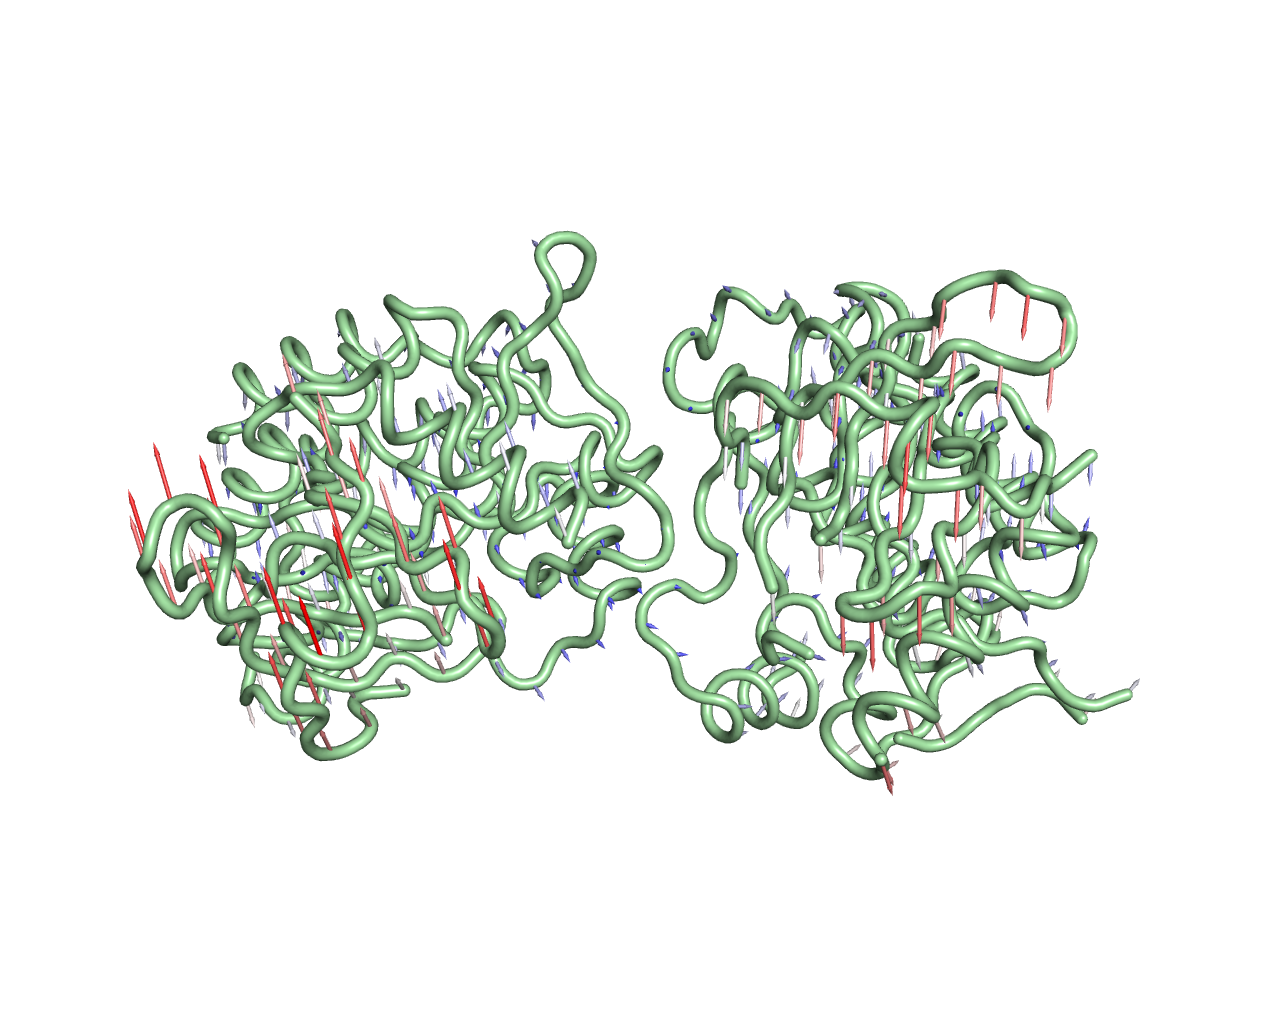
Atomic Fluctuation
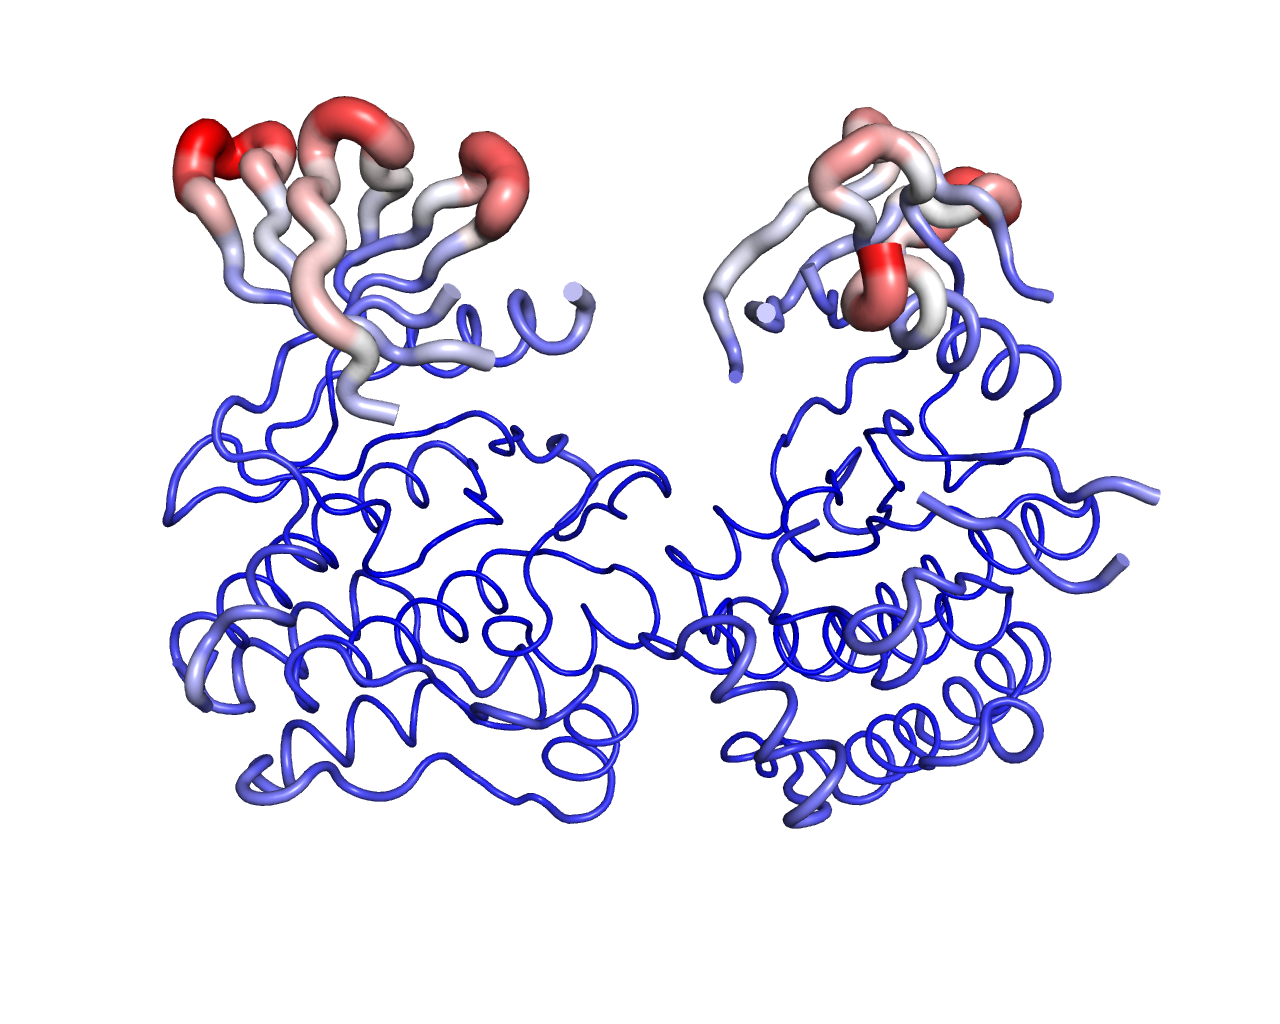
The magnitute of the deformation/fluctuation is represented by thin to thick tube colored blue (low), white (moderate) and red (high).
Download Resources
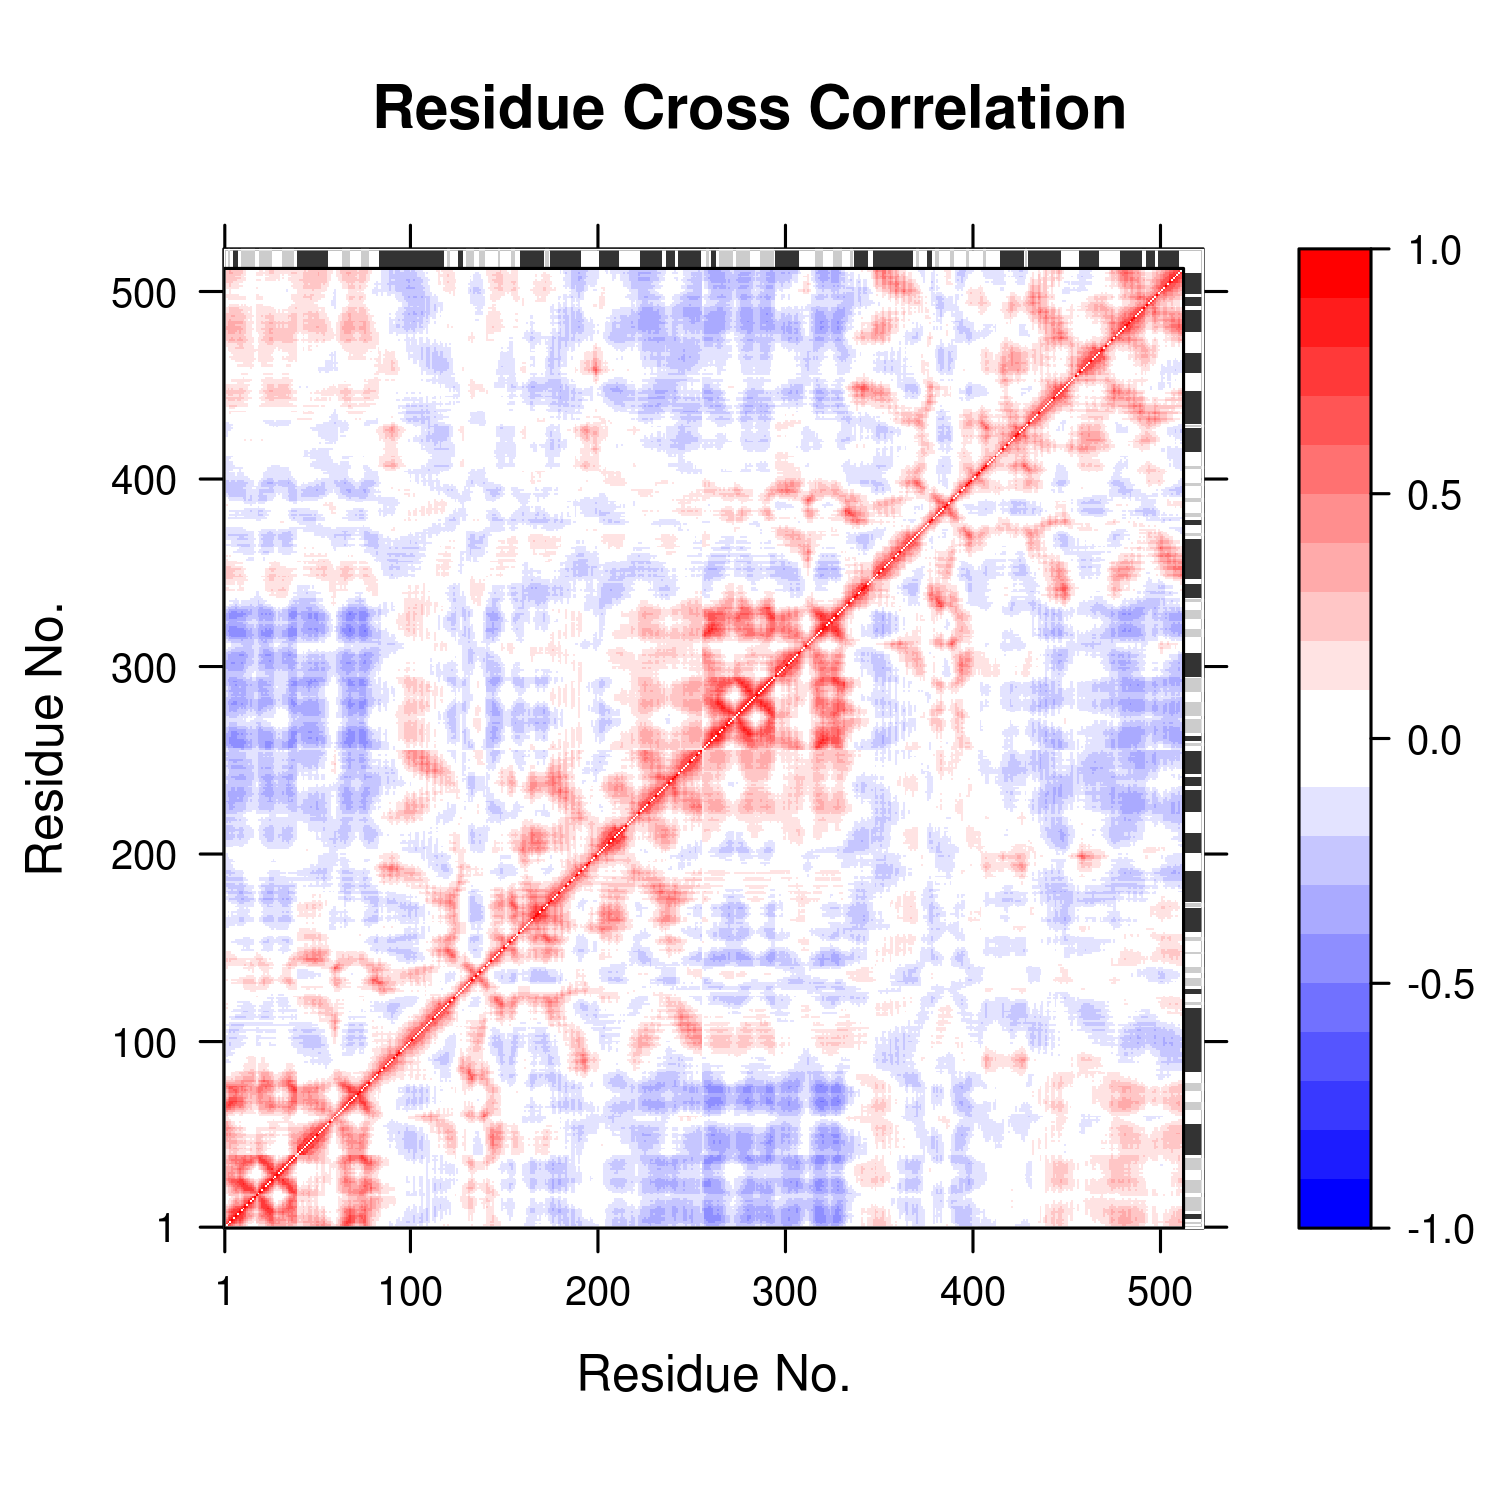
Dynamical Cross-Correlation Map (DCCM)
All modes were used to calculated the residue cross-correlation.
Correlation map revealing correlated (red) and anti-correlated (blue) regions in the protein structure.
Assuming: Cab = Correlation between residues a and b
If Cab = 1 the fluctuations of residues A and B are completely correlated (same period and same phase), if Cab = -1 the fluctuations of residues a and b are completely anticorrelated (same period and opposite phase), and if Cab = 0 the fluctuations of a and b are not correlated.
3D Representation
Correlated Residues
Correlation between 0.8 and 1.0

Correlation between 0.6 and 0.8
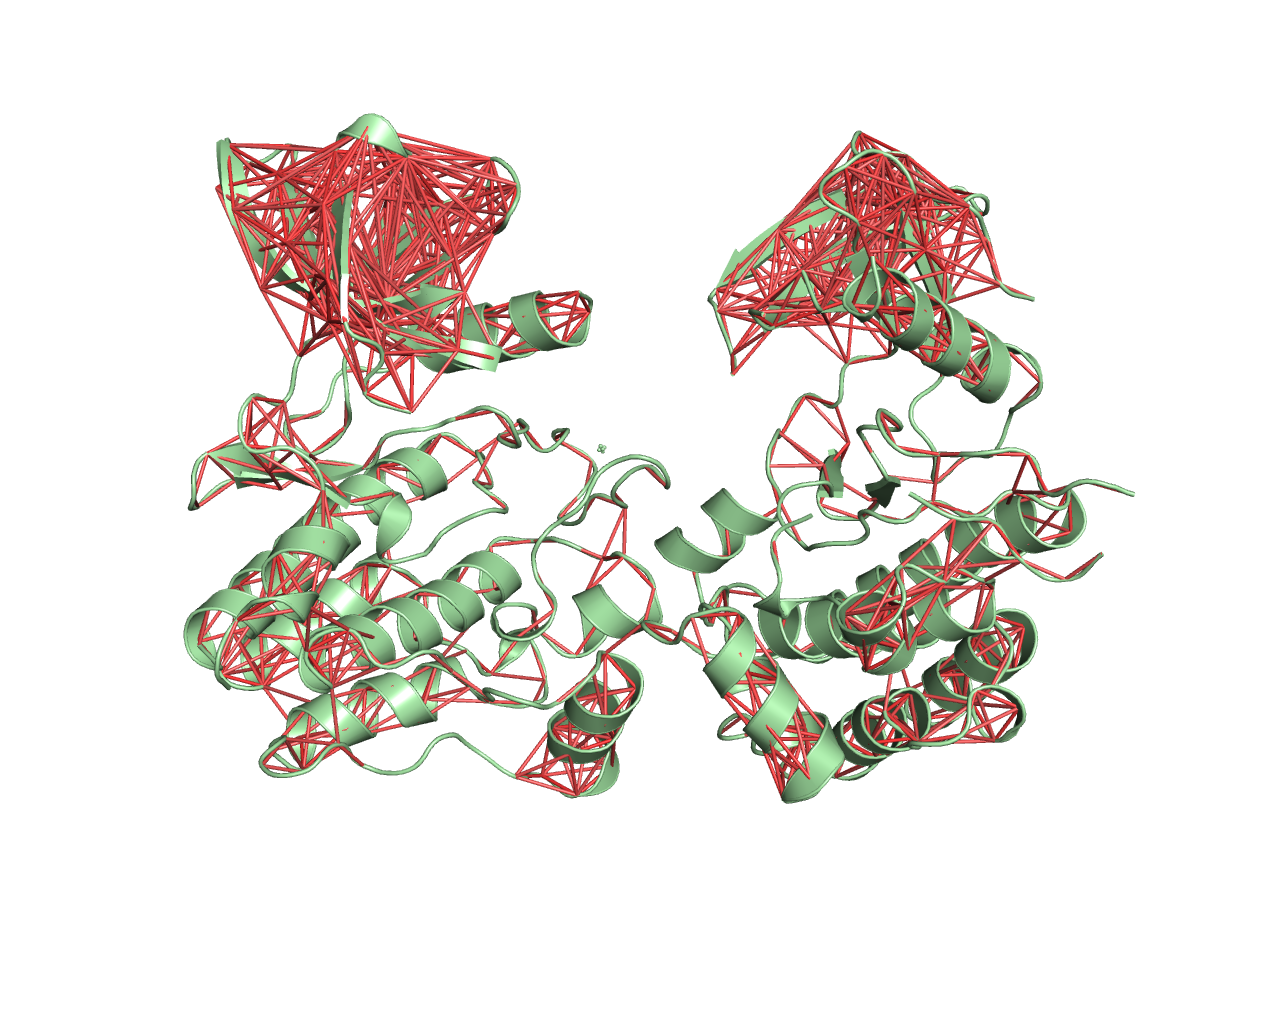
Correlation between 0.4 and 0.6

Correlation between 0.2 and 0.4
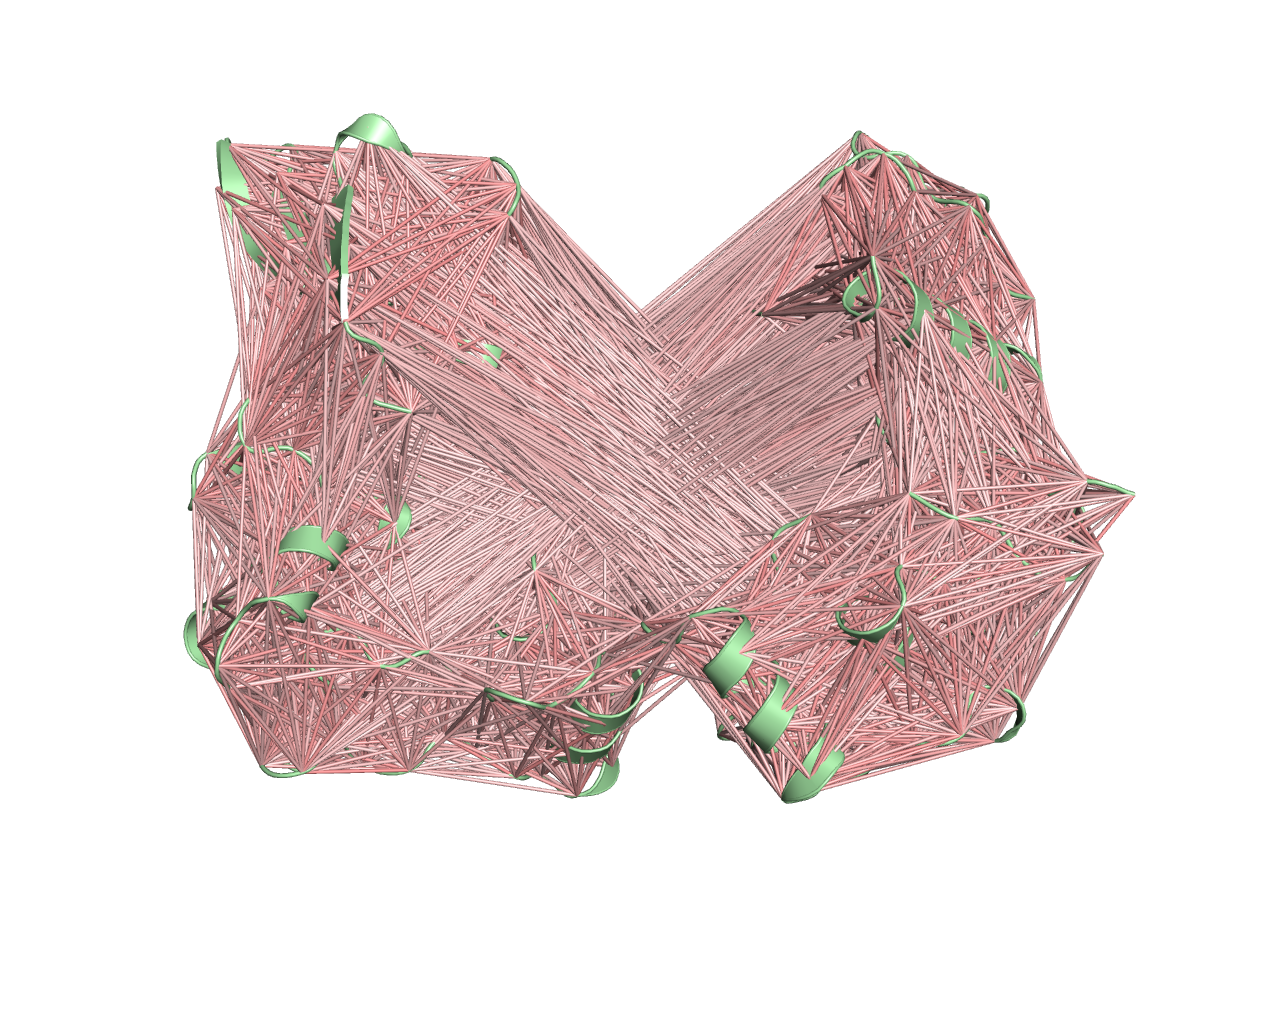
Anti-correlated Residues
Correlation between -0.6 and -0.4

Correlation between -0.4 and -0.2