1.Submission Page
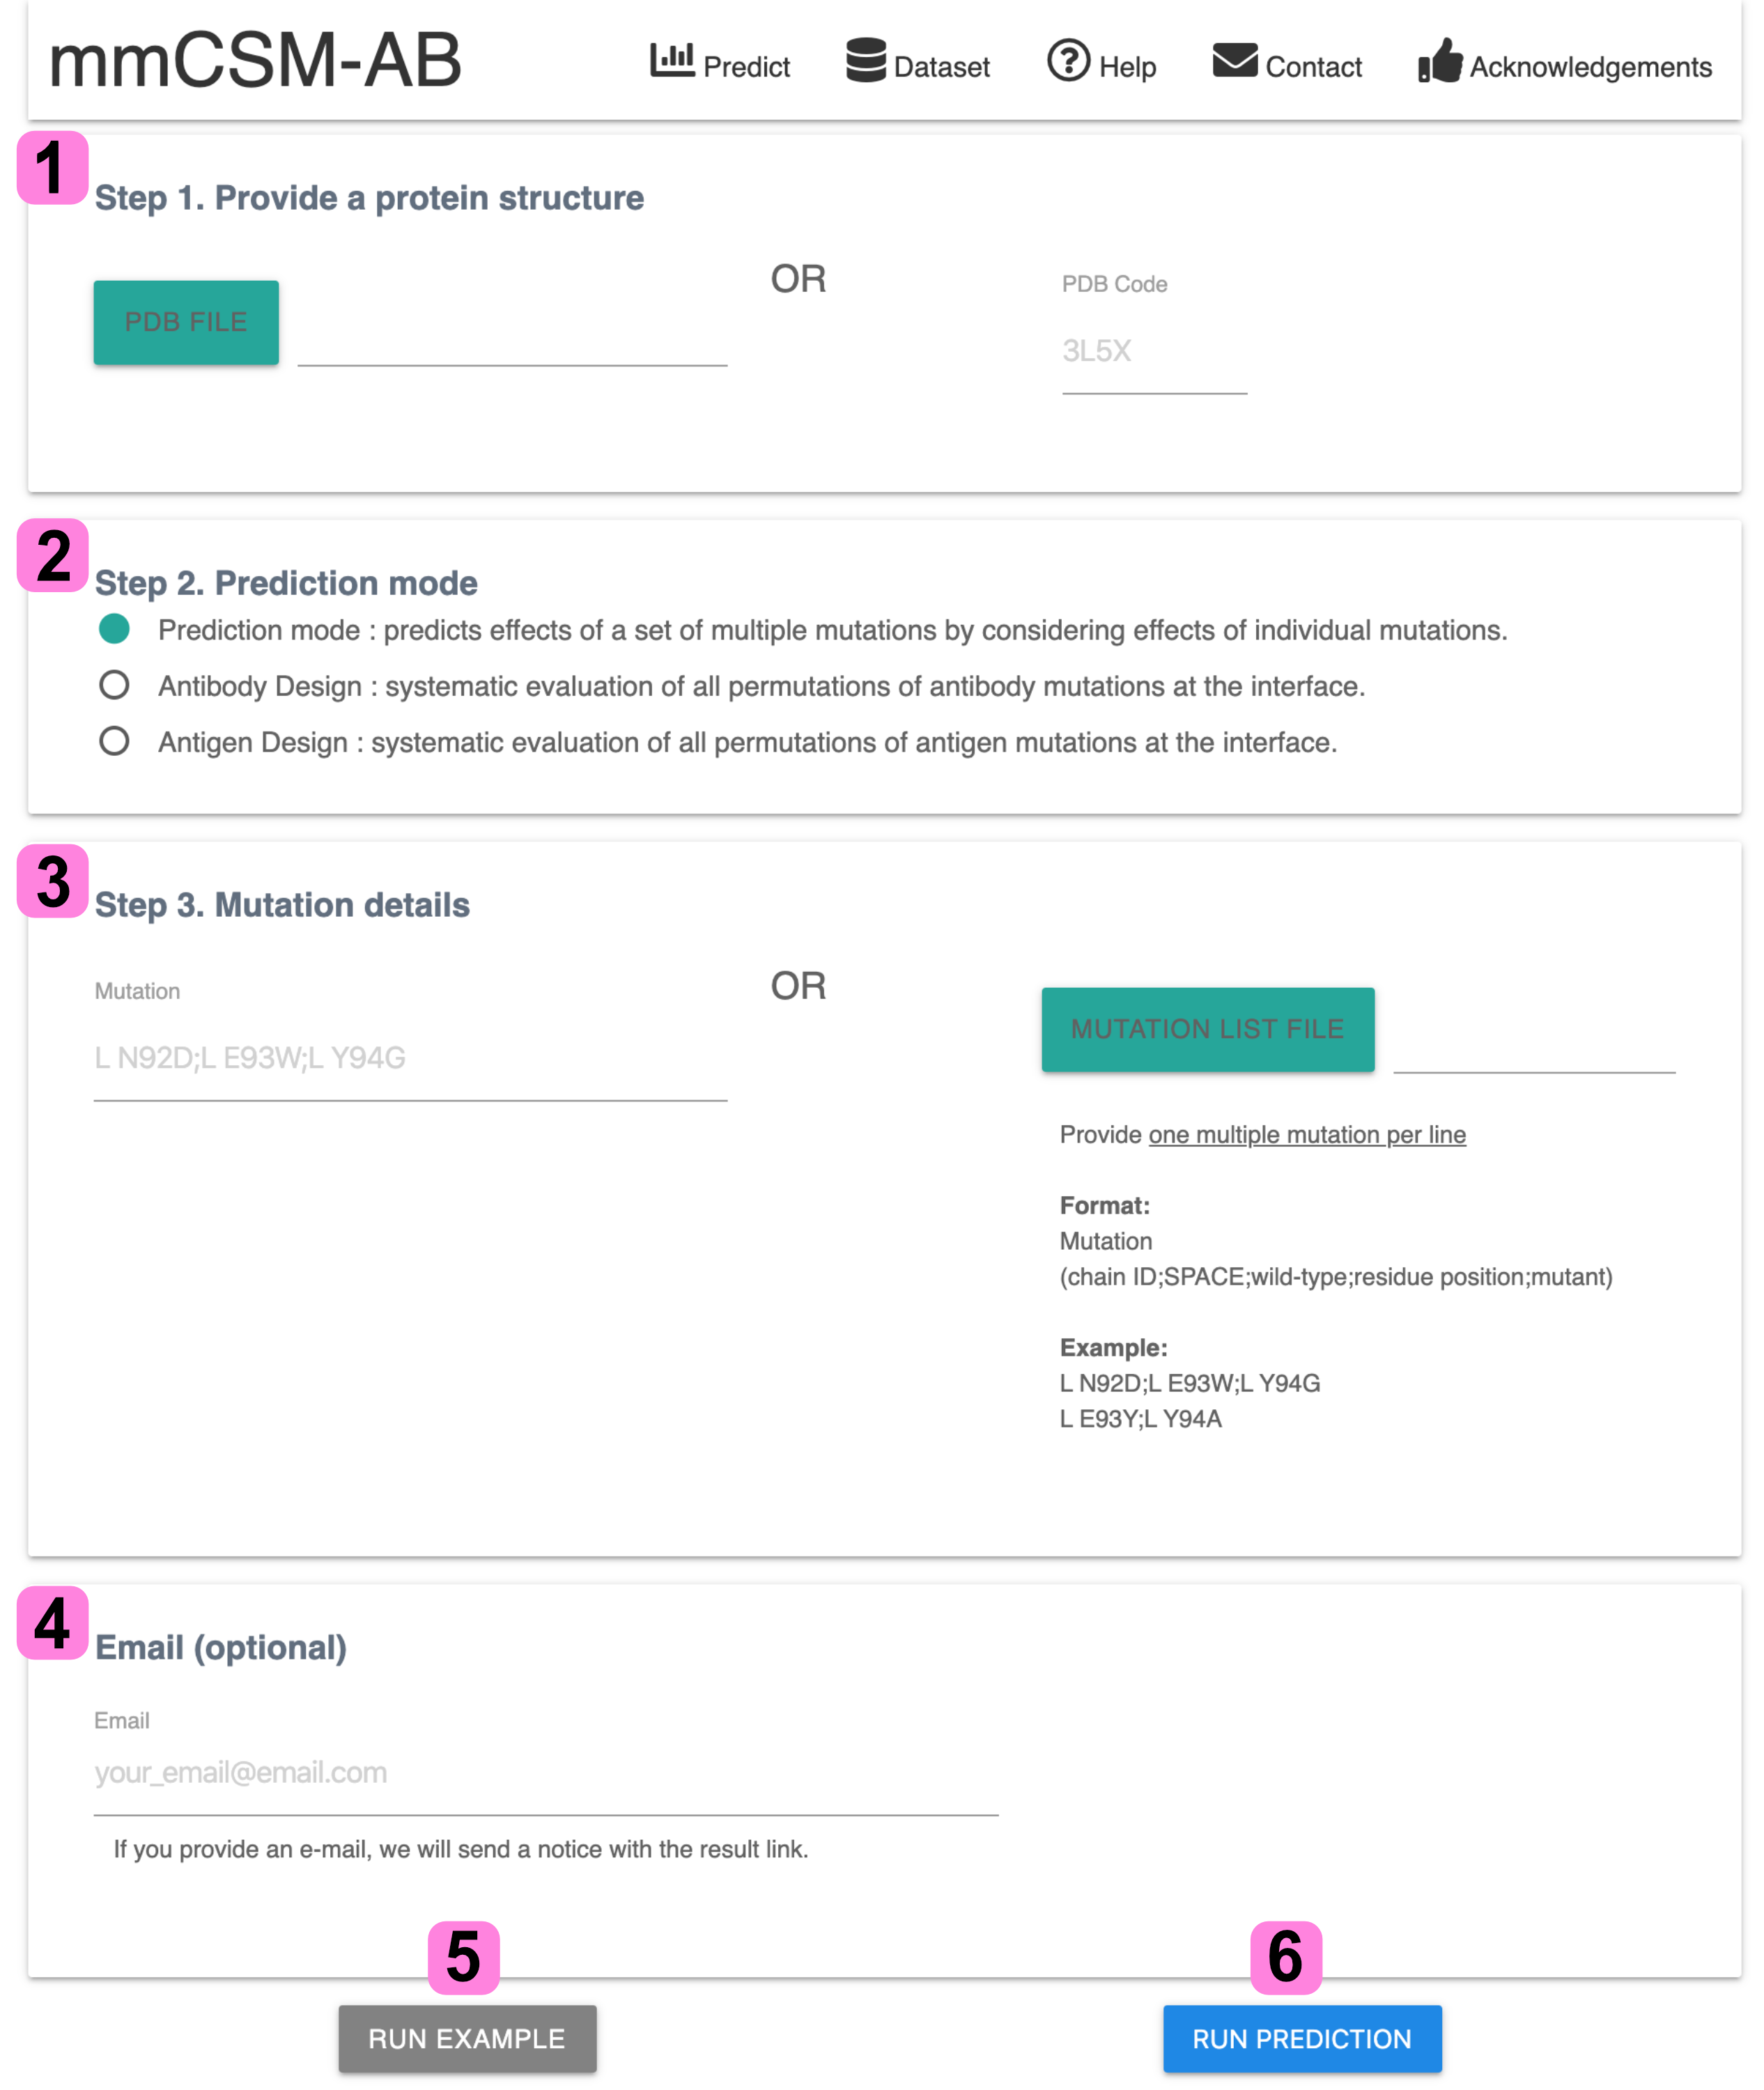
1. An antibody-antigen complex can be provided by either of PDB file or PDB code.
2. Prediction mode among Prediction/Antibody Design/Antigen Design needs to be selected based on the purpose of the prediction.
3. For Prdiction Mode, the mutation details can be given by typing in input textarea or uploading a mutation list file (support more than one multiple mutation).
Both Antibody and Antigen Design Modes automatically allocate the binding interface residues for design mode predictions.
4. By providing an e-mail address, user can a notification email, after job completion.
5. To visit example pages for each mode, users have to select a prediction mode from step 2 and click 'Run Example' button.
6. Click RUN PREDICTION to get your prediction result.
2.Result Page- Prediction Mode
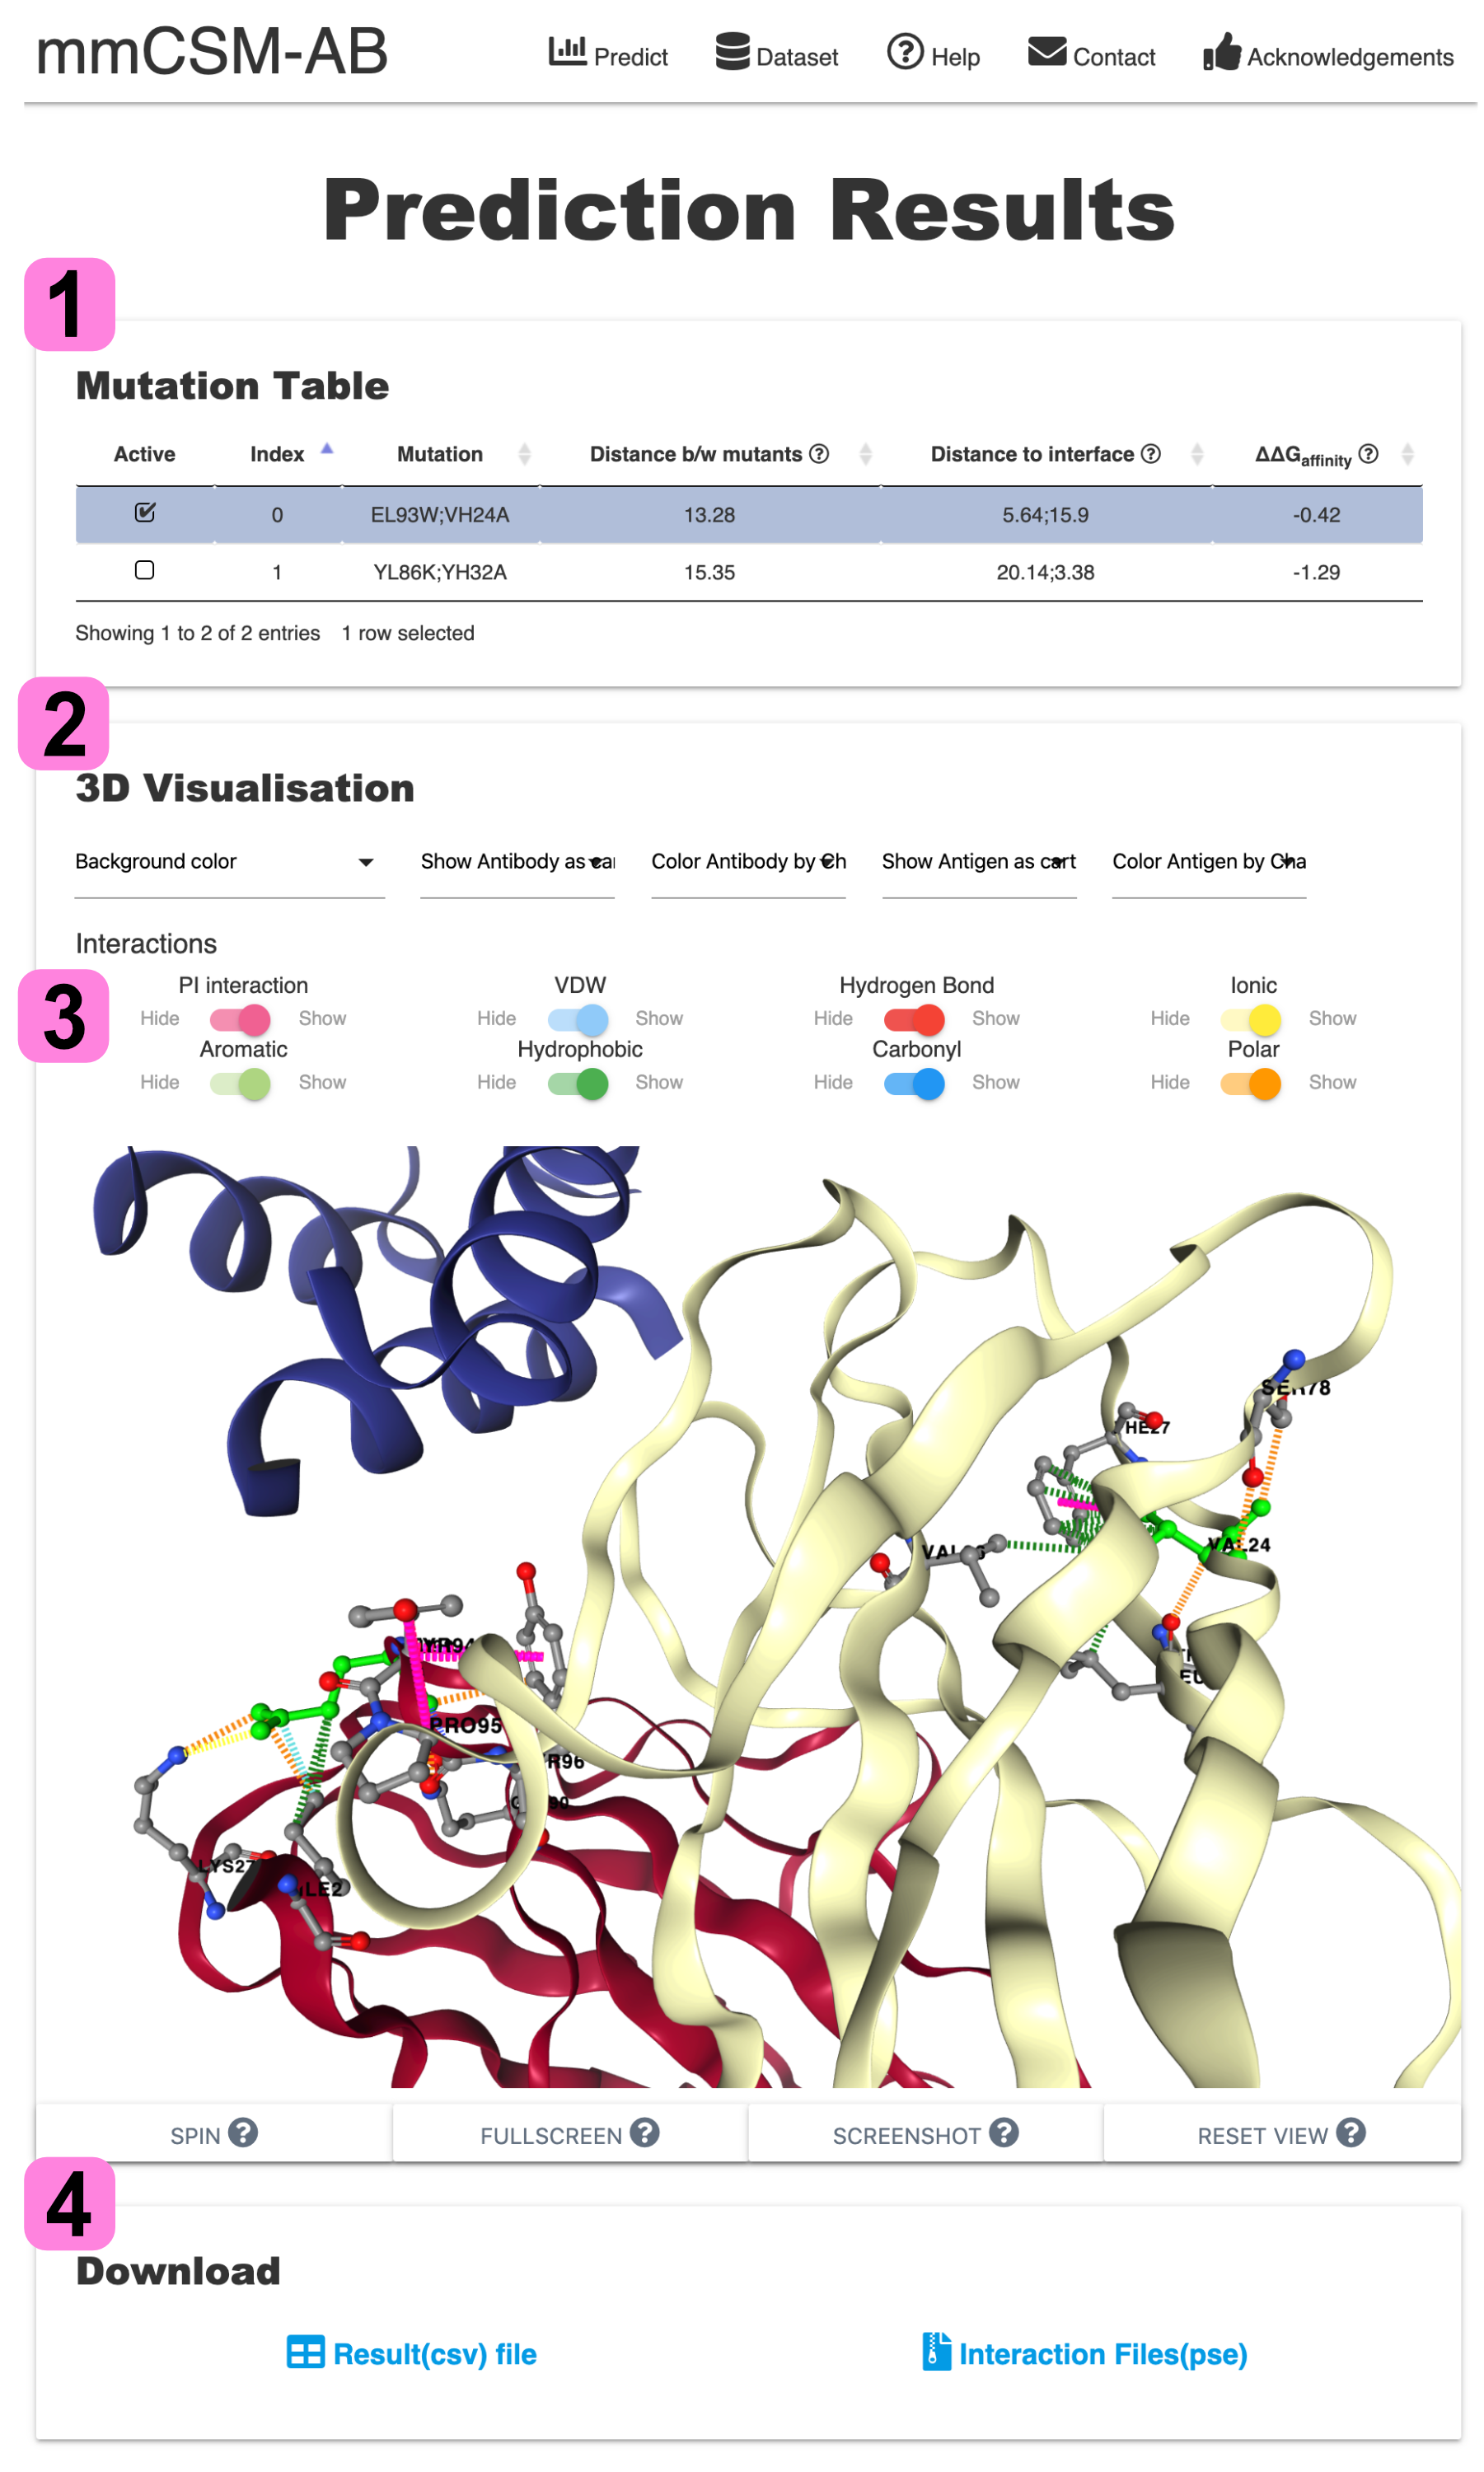
The result page of Prediction Mode is divided into three sections:
1. The Mutation Table section gives predicted ∆∆G and distance information (distance between mutants and distance to interface). If the mutation is more than two per case, the distance bw mutants shows distances between the centroid of each mutant and each Calpha carbon.
Users can locate mutations in the wild-type structure via 3D Visualisation ticking a checkbox of each multiple mutation from Mutation Table.
2. The 3D Visualisation provides wild-type atomic interactions of a given multiple point mutation. Using control panel, users are able to change the representation of antibody-antigen structure.
3. Each interaction can be turned on/off using switches of which the colours are matched with the dashed-line in 3D viewer.
4. All information (interaction and mutation table) can be downloaded as Pymol-session(PSE) and CSV files respectively.
3.Result Page- Design Mode
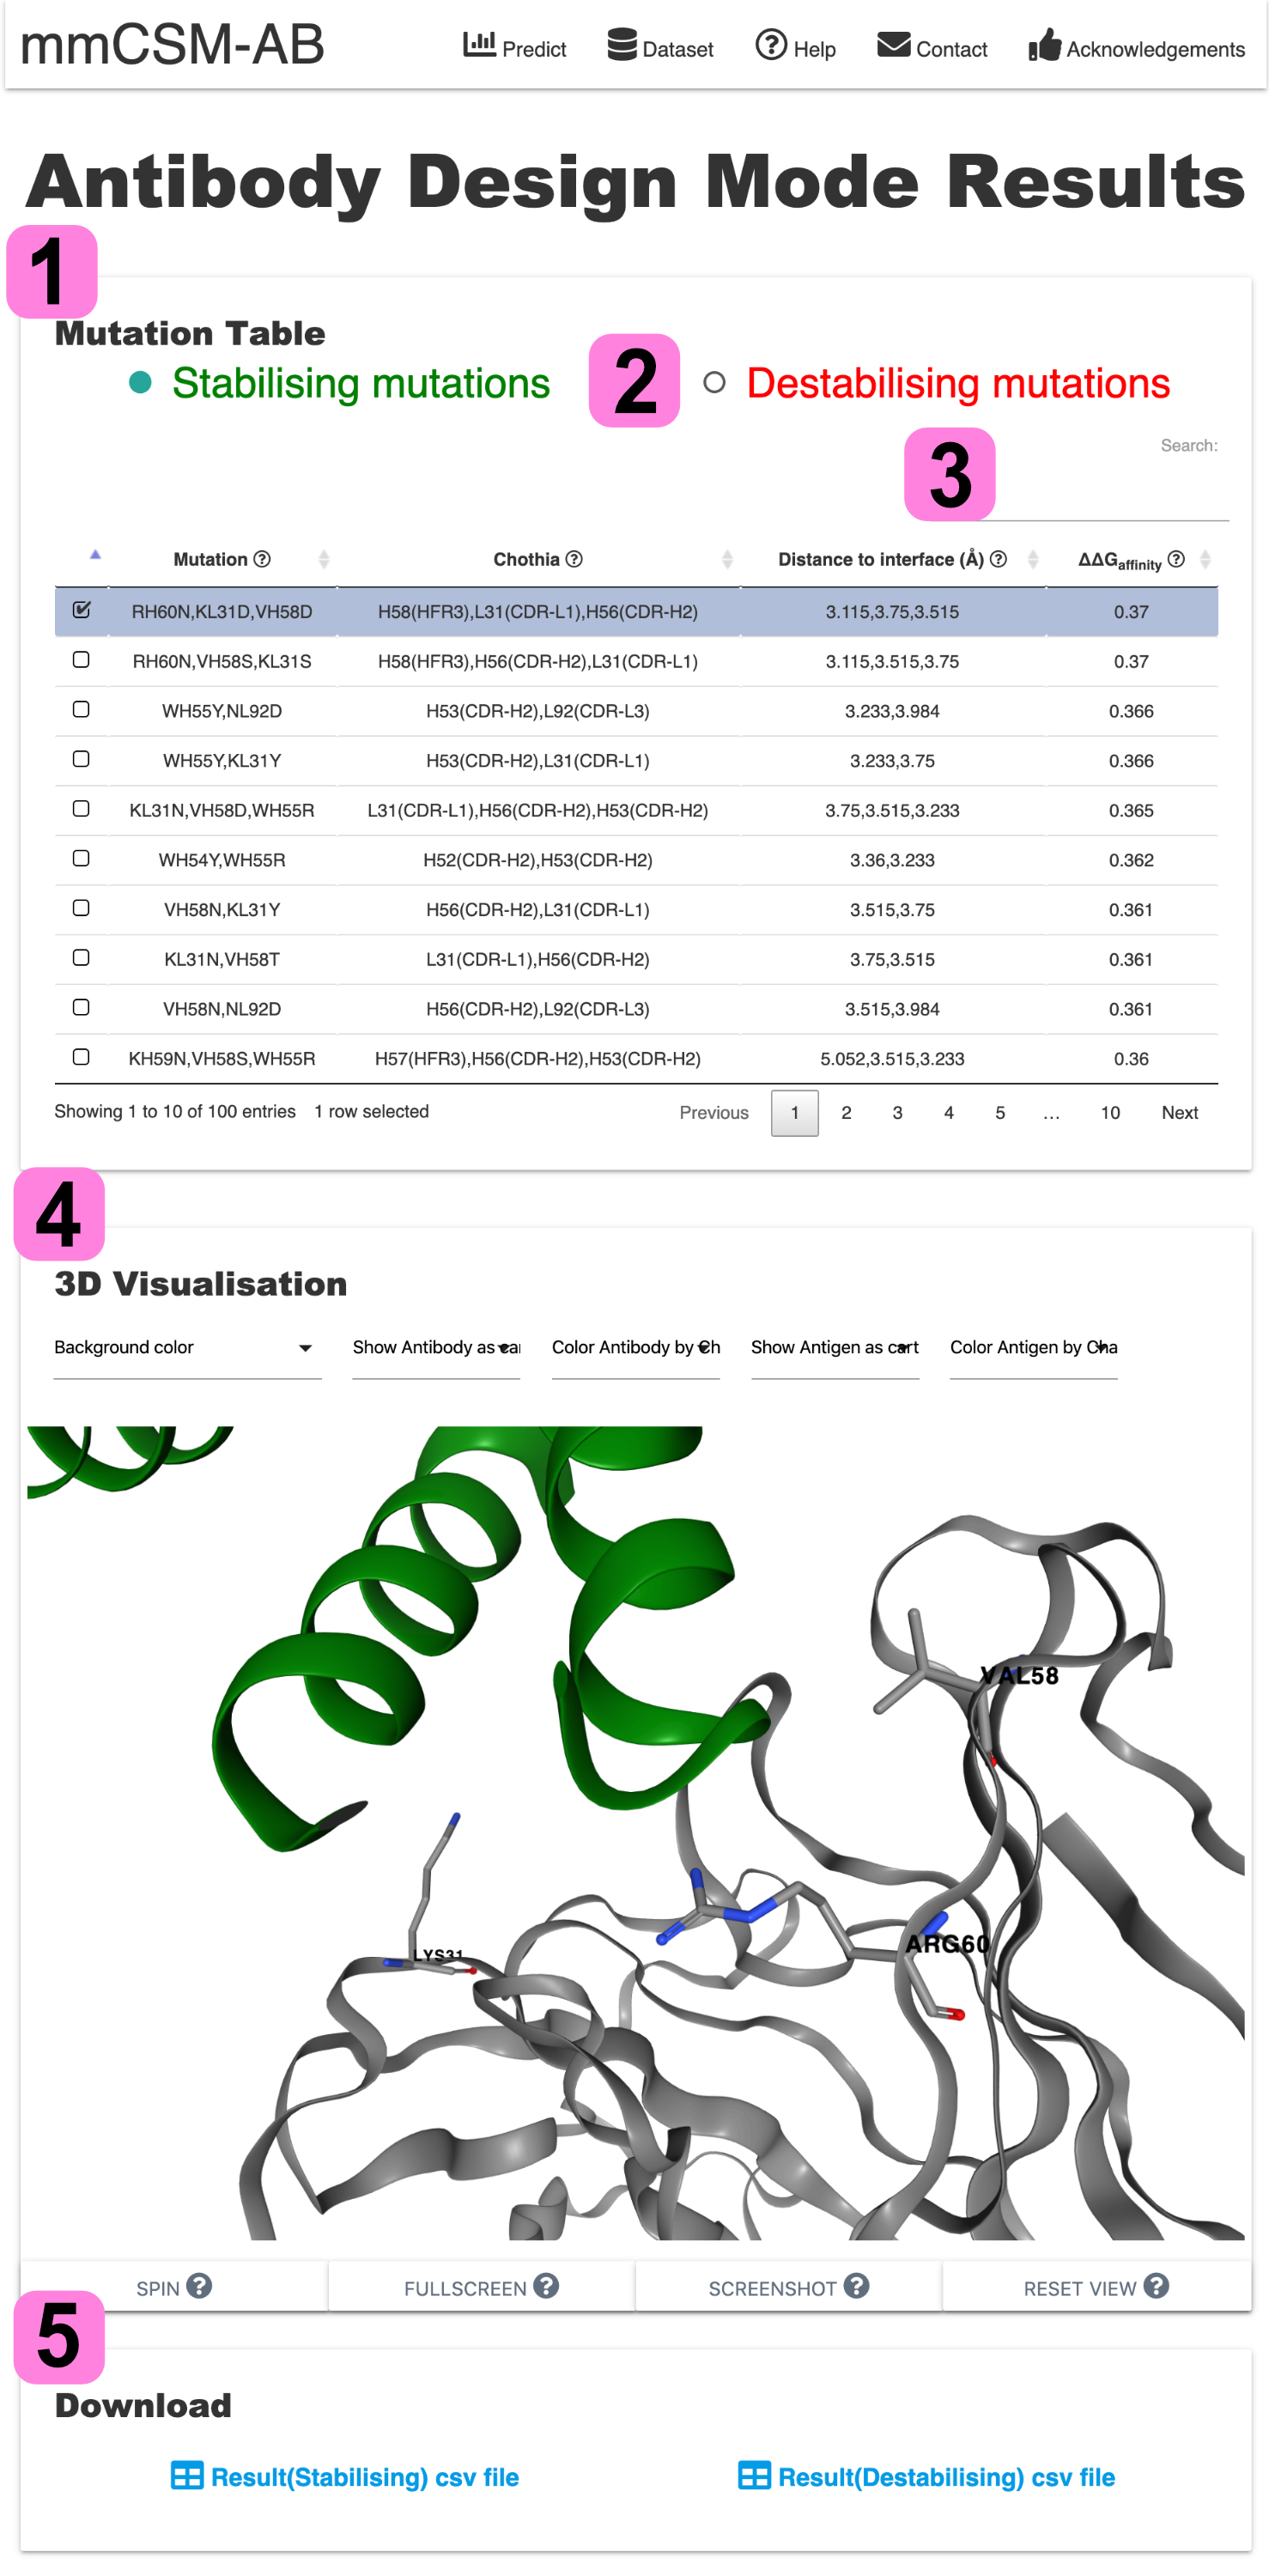
1. Mutation Table shows the top 100 destabilising/stabilising mutations for antibody-antigen interface residues. The predicted ∆∆G and corresponding information (Chothia annotation and Distance to interface) are shown in the table.
2. Users can select stabilising or destabilising datatable.
3. Once datatable is selected, users can browse or search for information in the datatable.
4. Once user selects a multiple mutation(row) in the table, 3D Visualisation highlights the location of mutations in the antibody-antigen interface. The representation of antibody and antigen can be changed through the control panel.
5. Users can download both stabilising/destabilising datatable in CSV file separately.