About VIVID
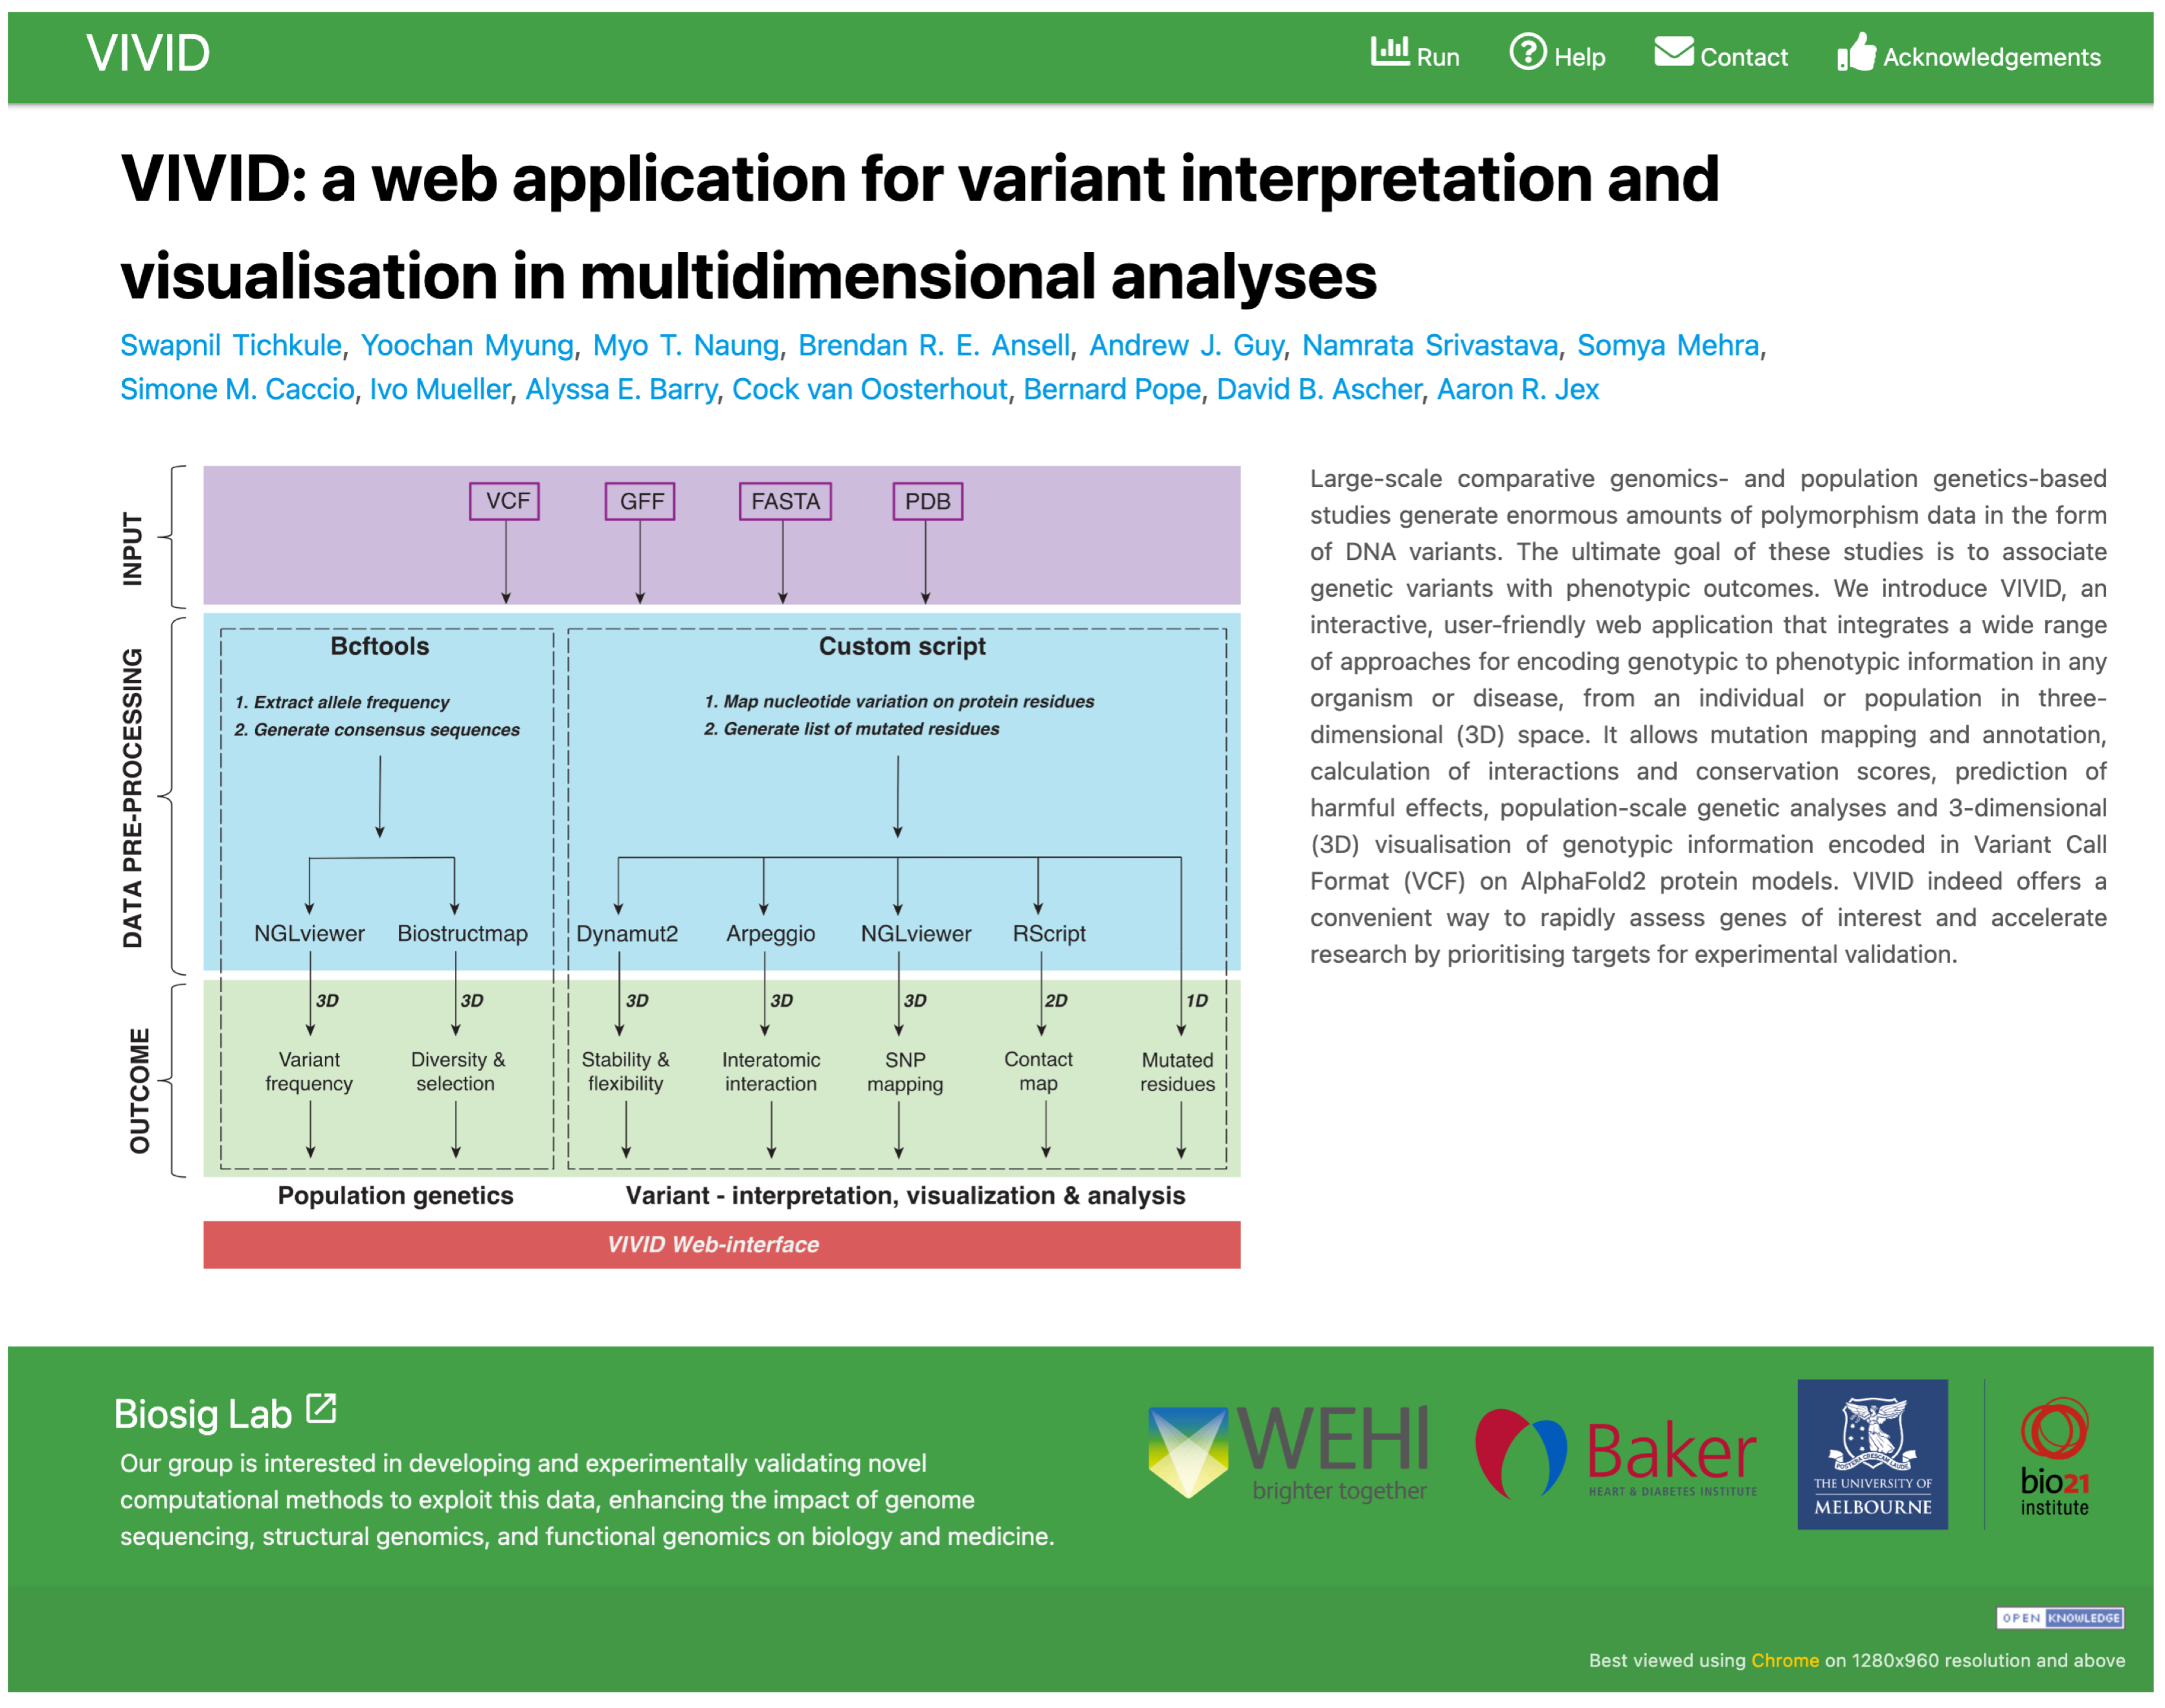
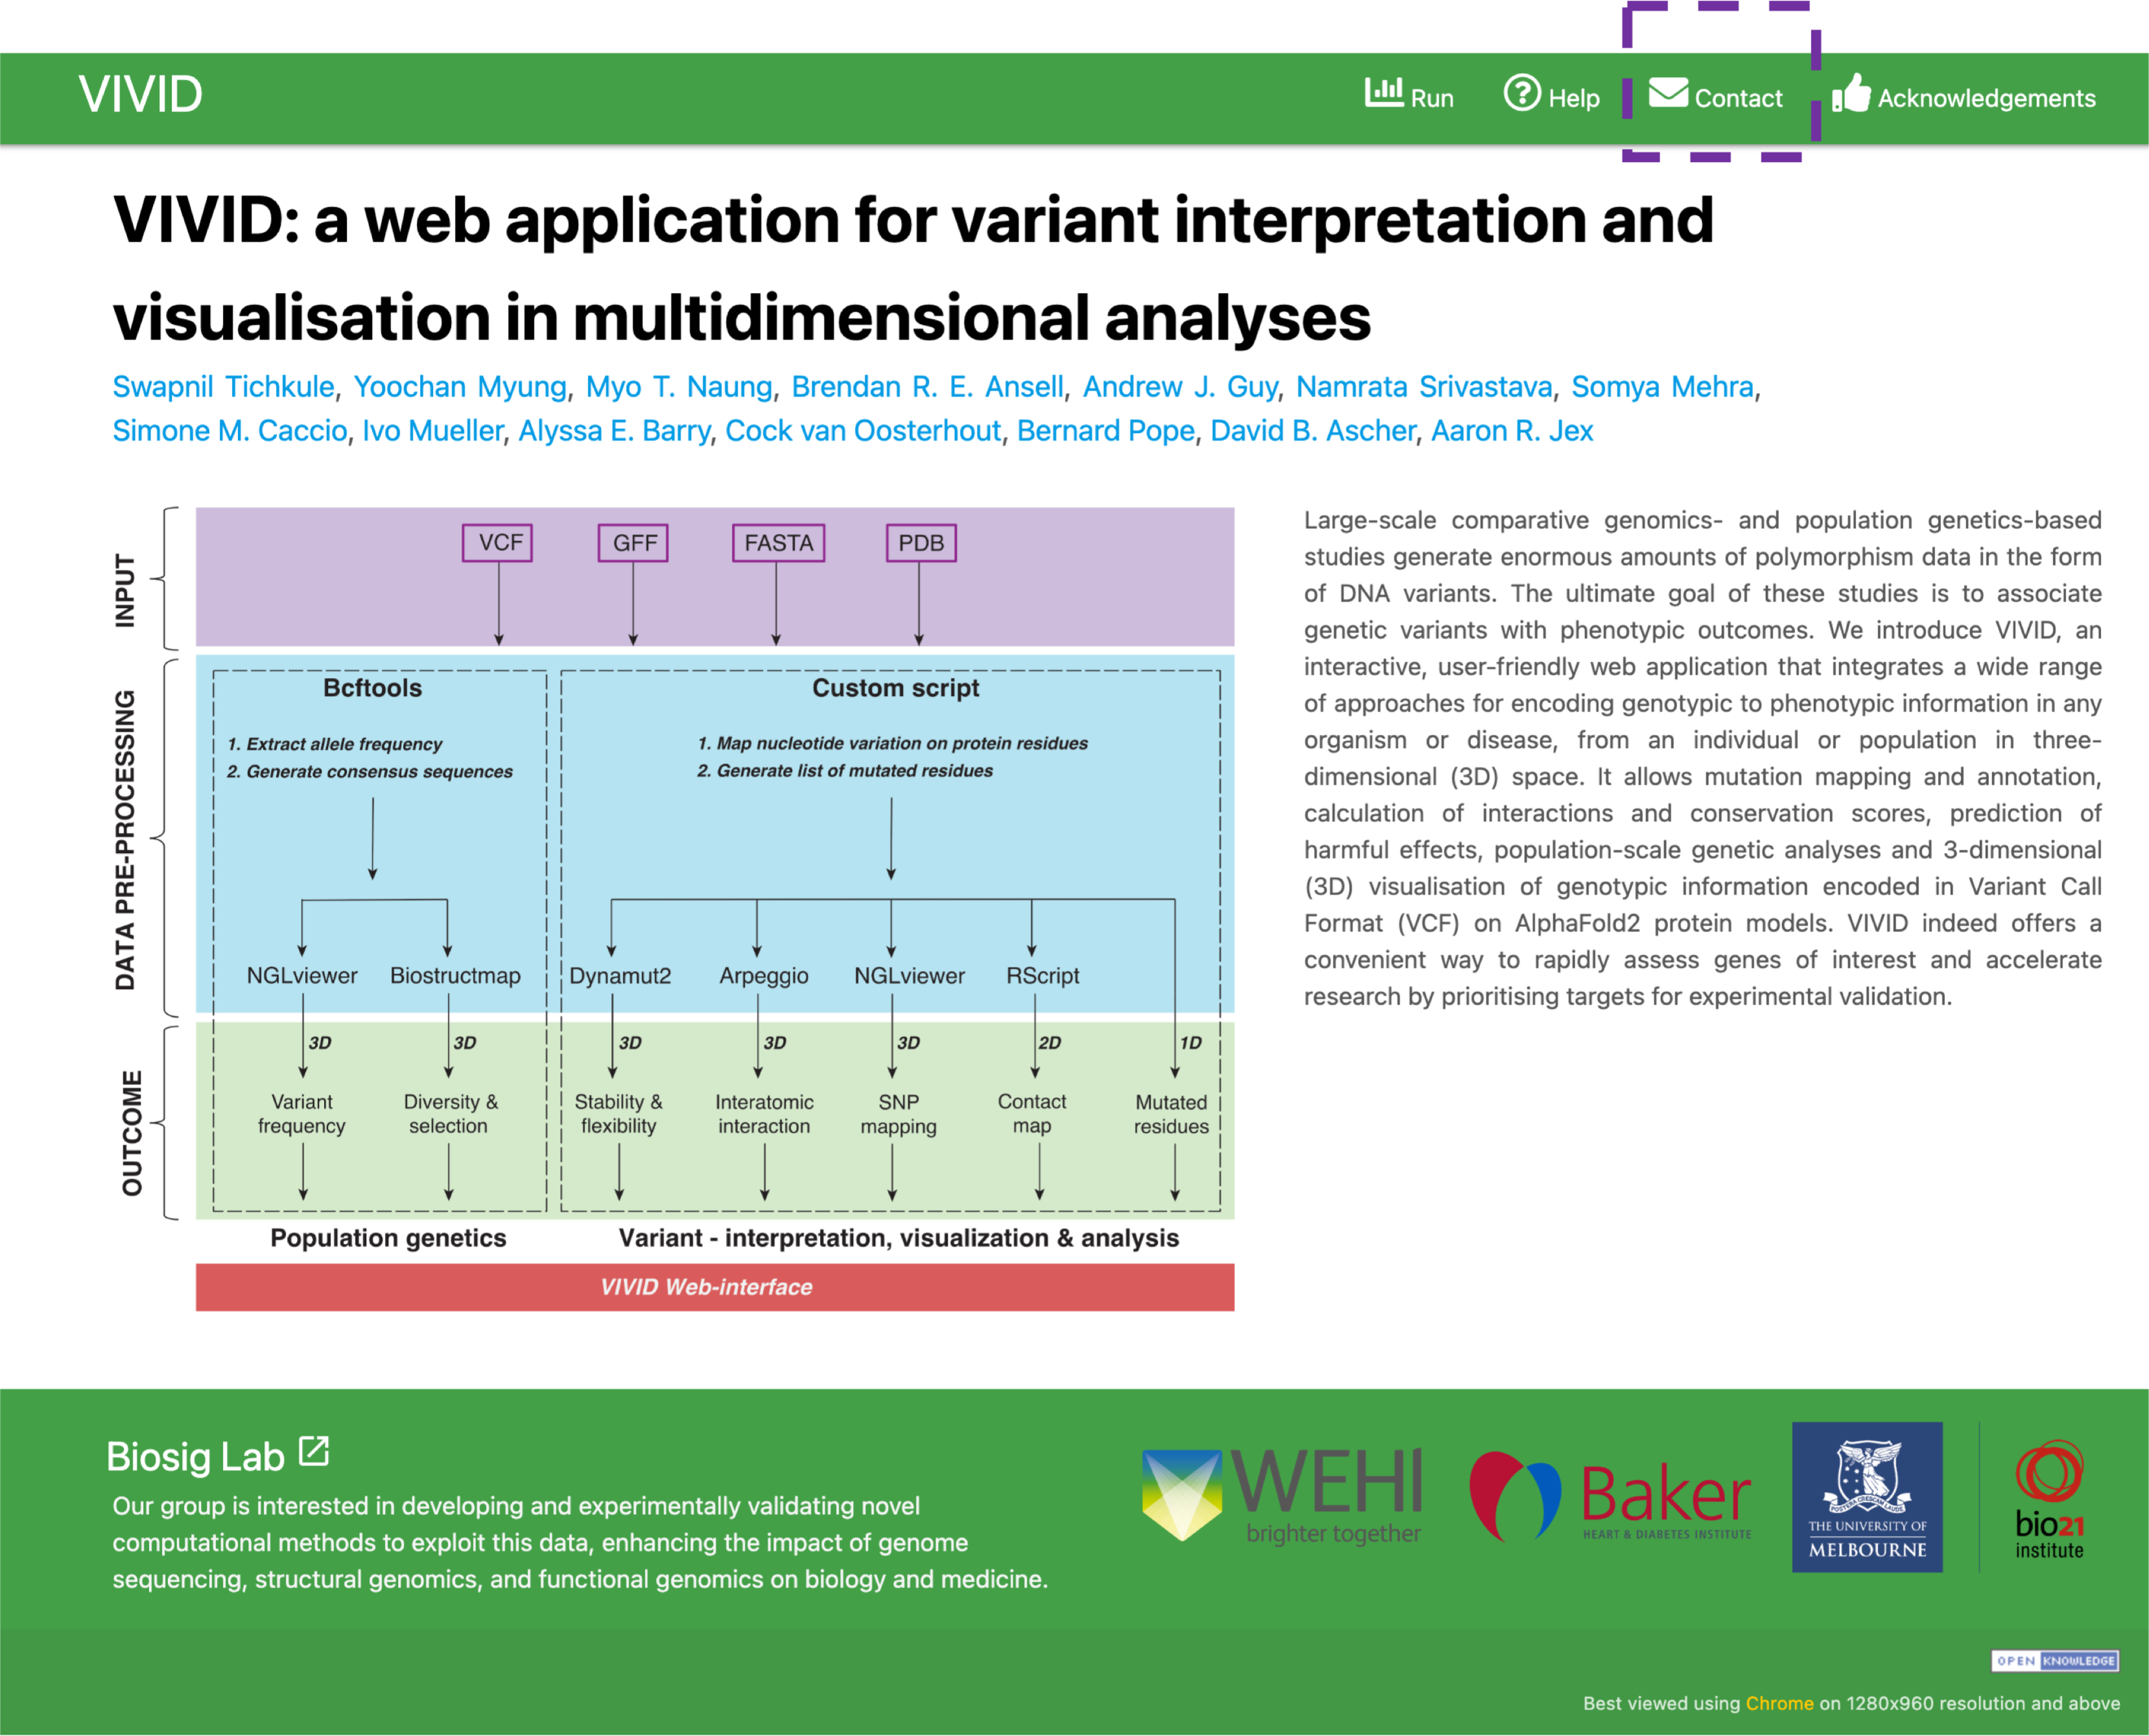
VIVID is a user-friendly web-server that allows users to visualise genomic mutations from
single-individual to population-scale for their impacts on protein structure, function, and
evolution.
Step-by-Step VIVID tutorial is also available via video and
PDF.
Read more here: Pre-print manuscript
Download
example dataset 1
Plasmodium falciparum: Erythrocyte binding antigen protein
(source)
Download
example dataset 2
SARS-CoV-2: Spike protein (source)
Run Analysis
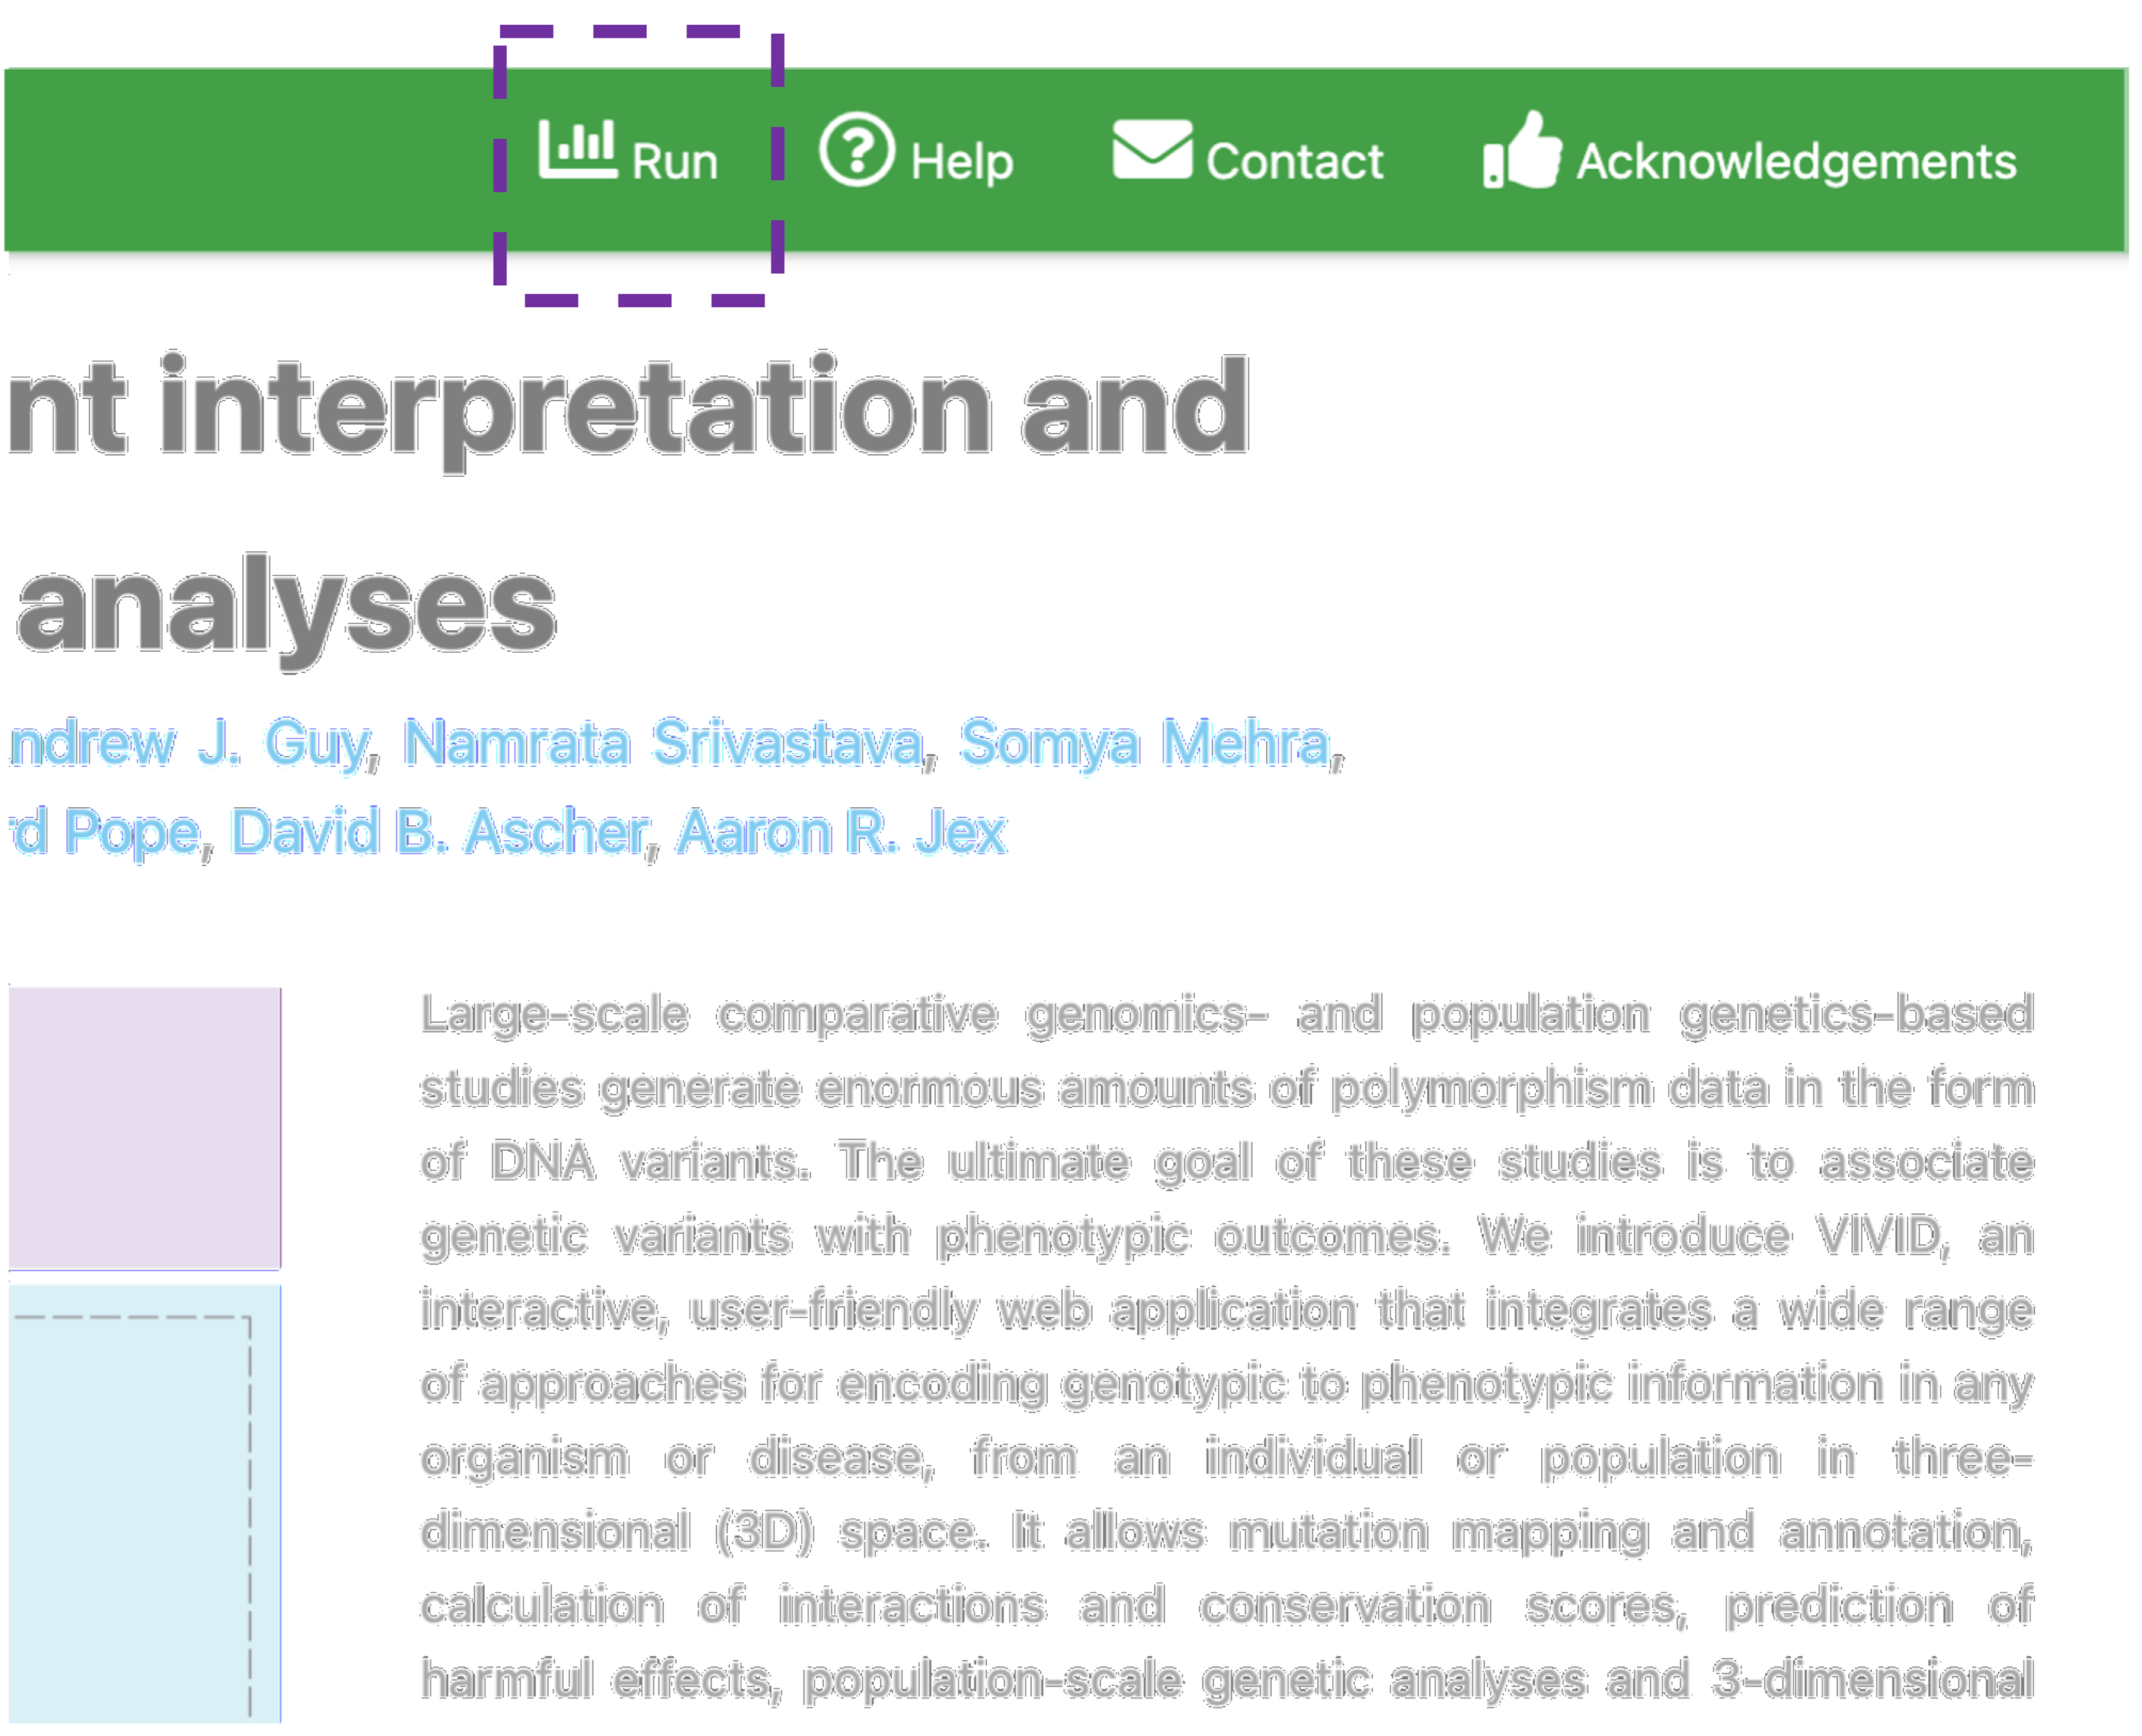
The job submission page for input files can be accessed via the menu item Run on the top bar menu.
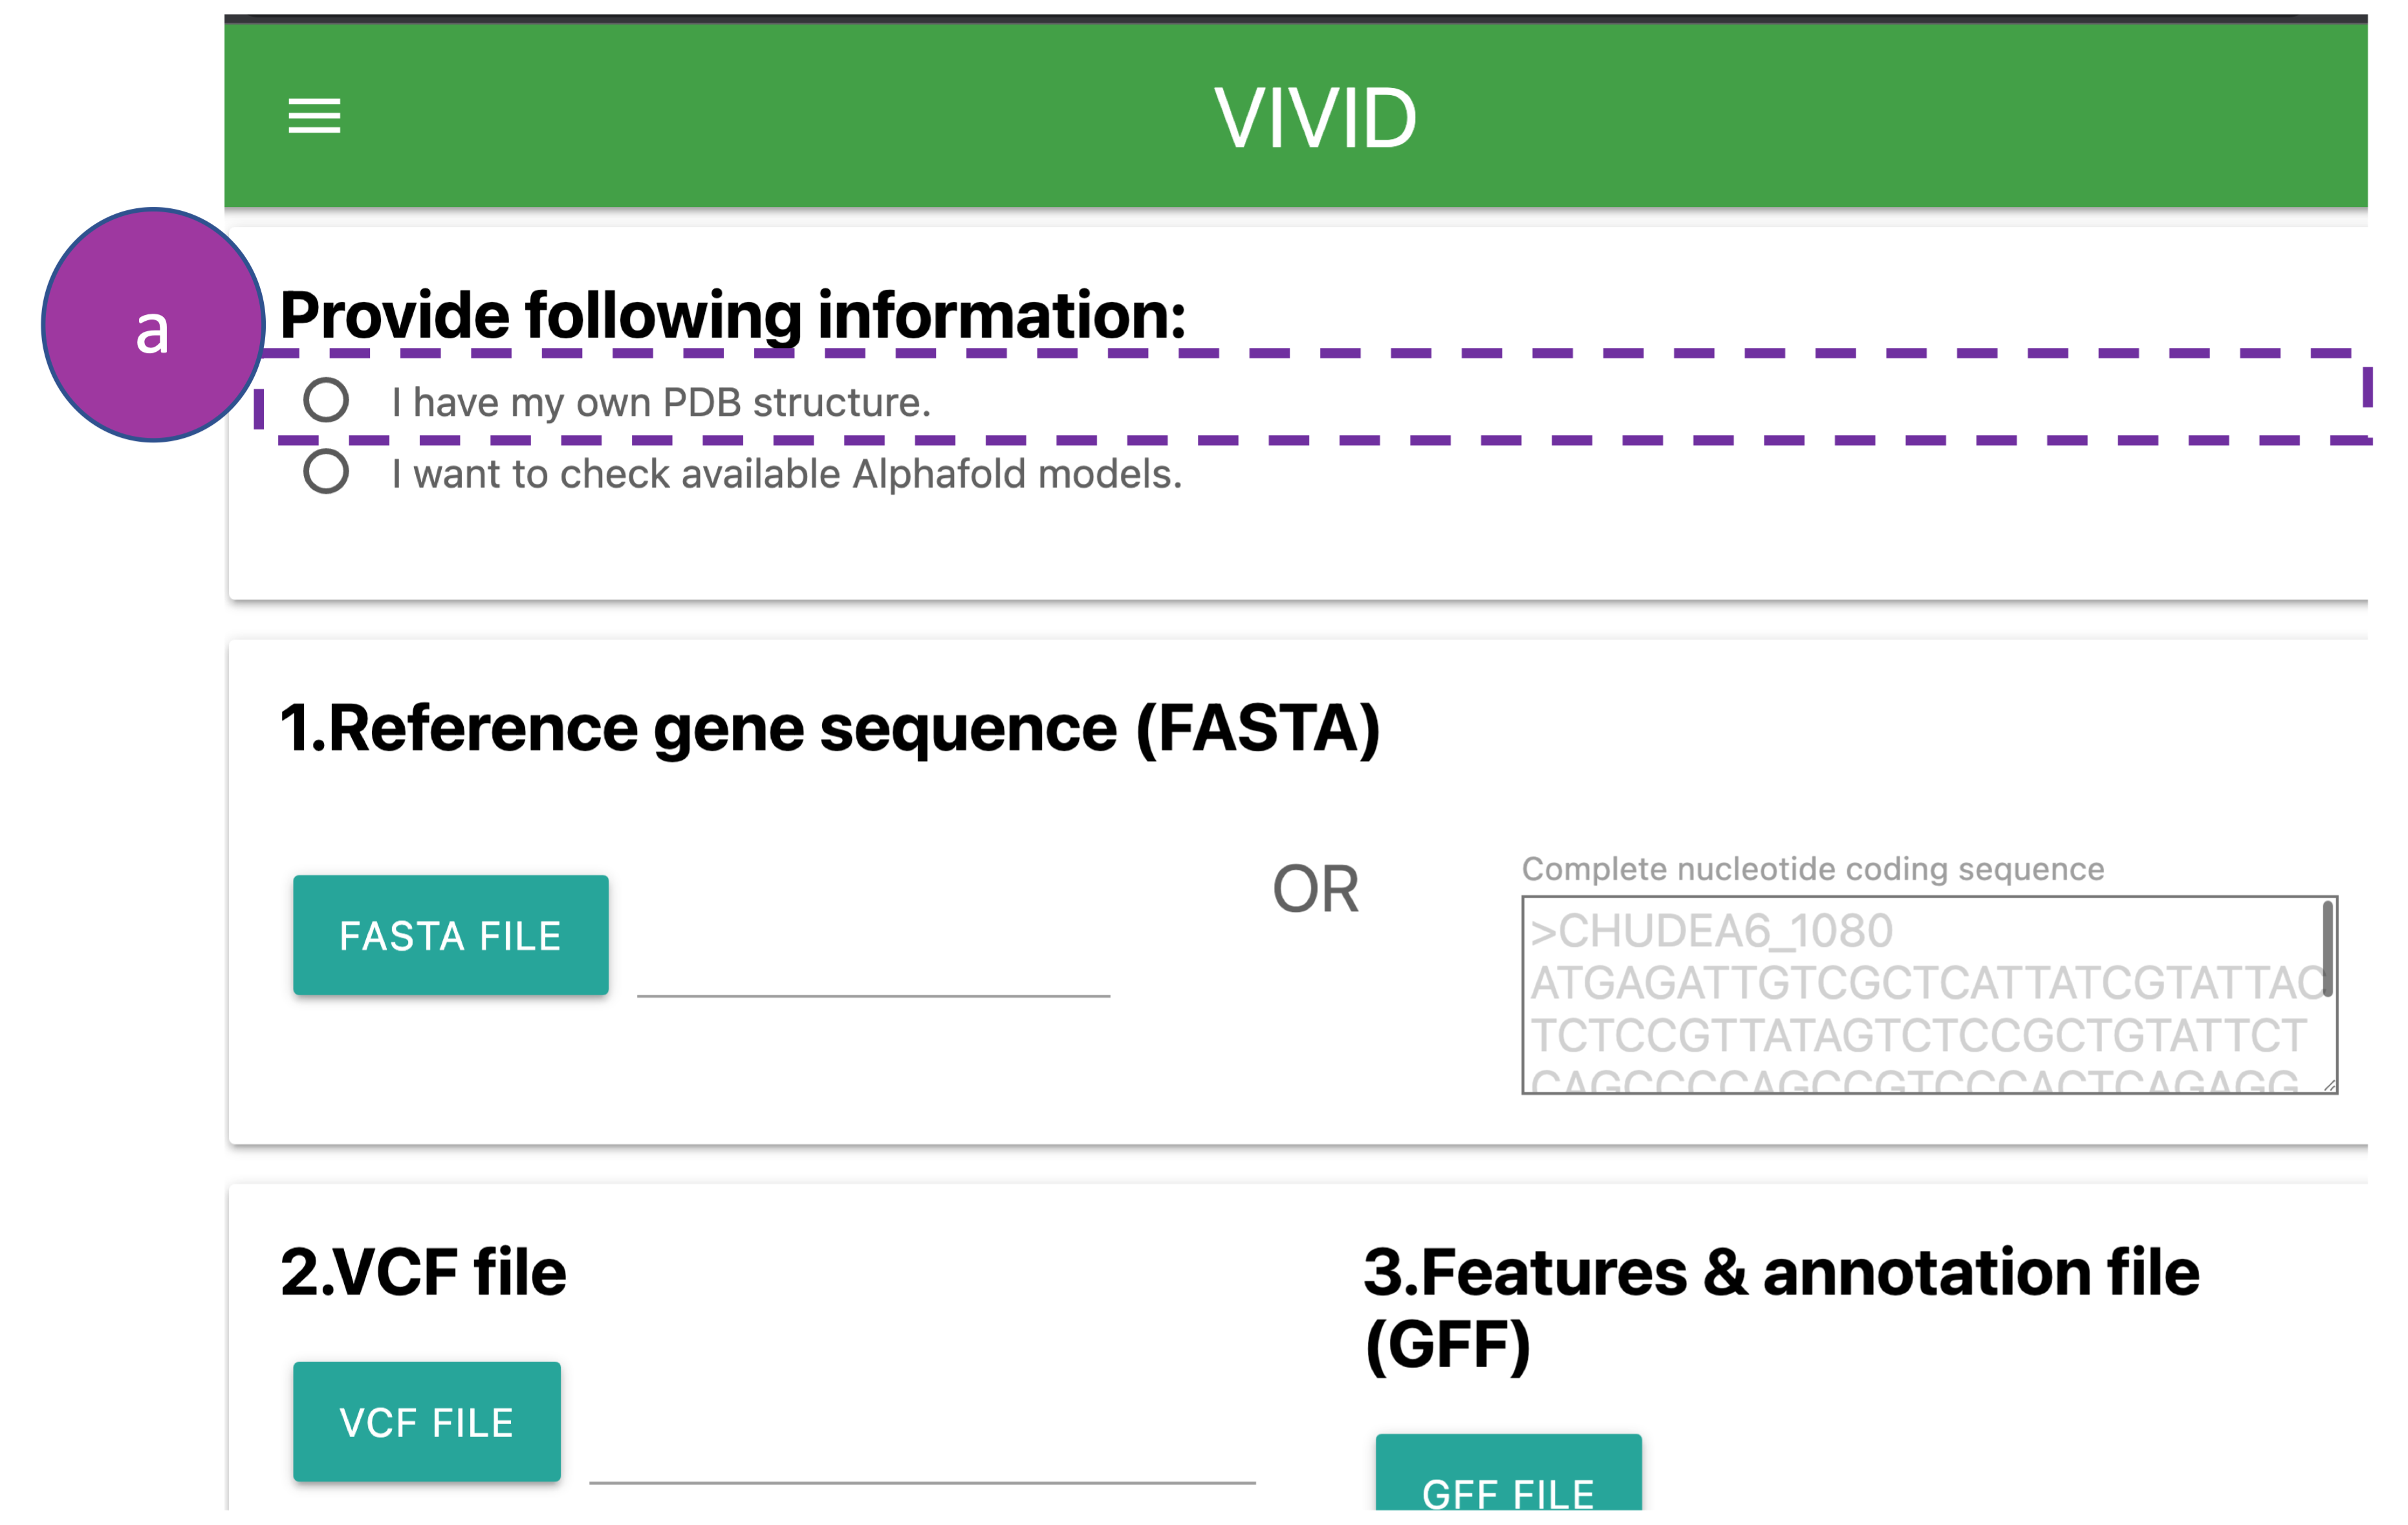
Provide following information:
At this input step users have two options to provide a protein structure (PDB file):
(a) Upload a protein structure from the local system or access it via the RCSB PDB
database.
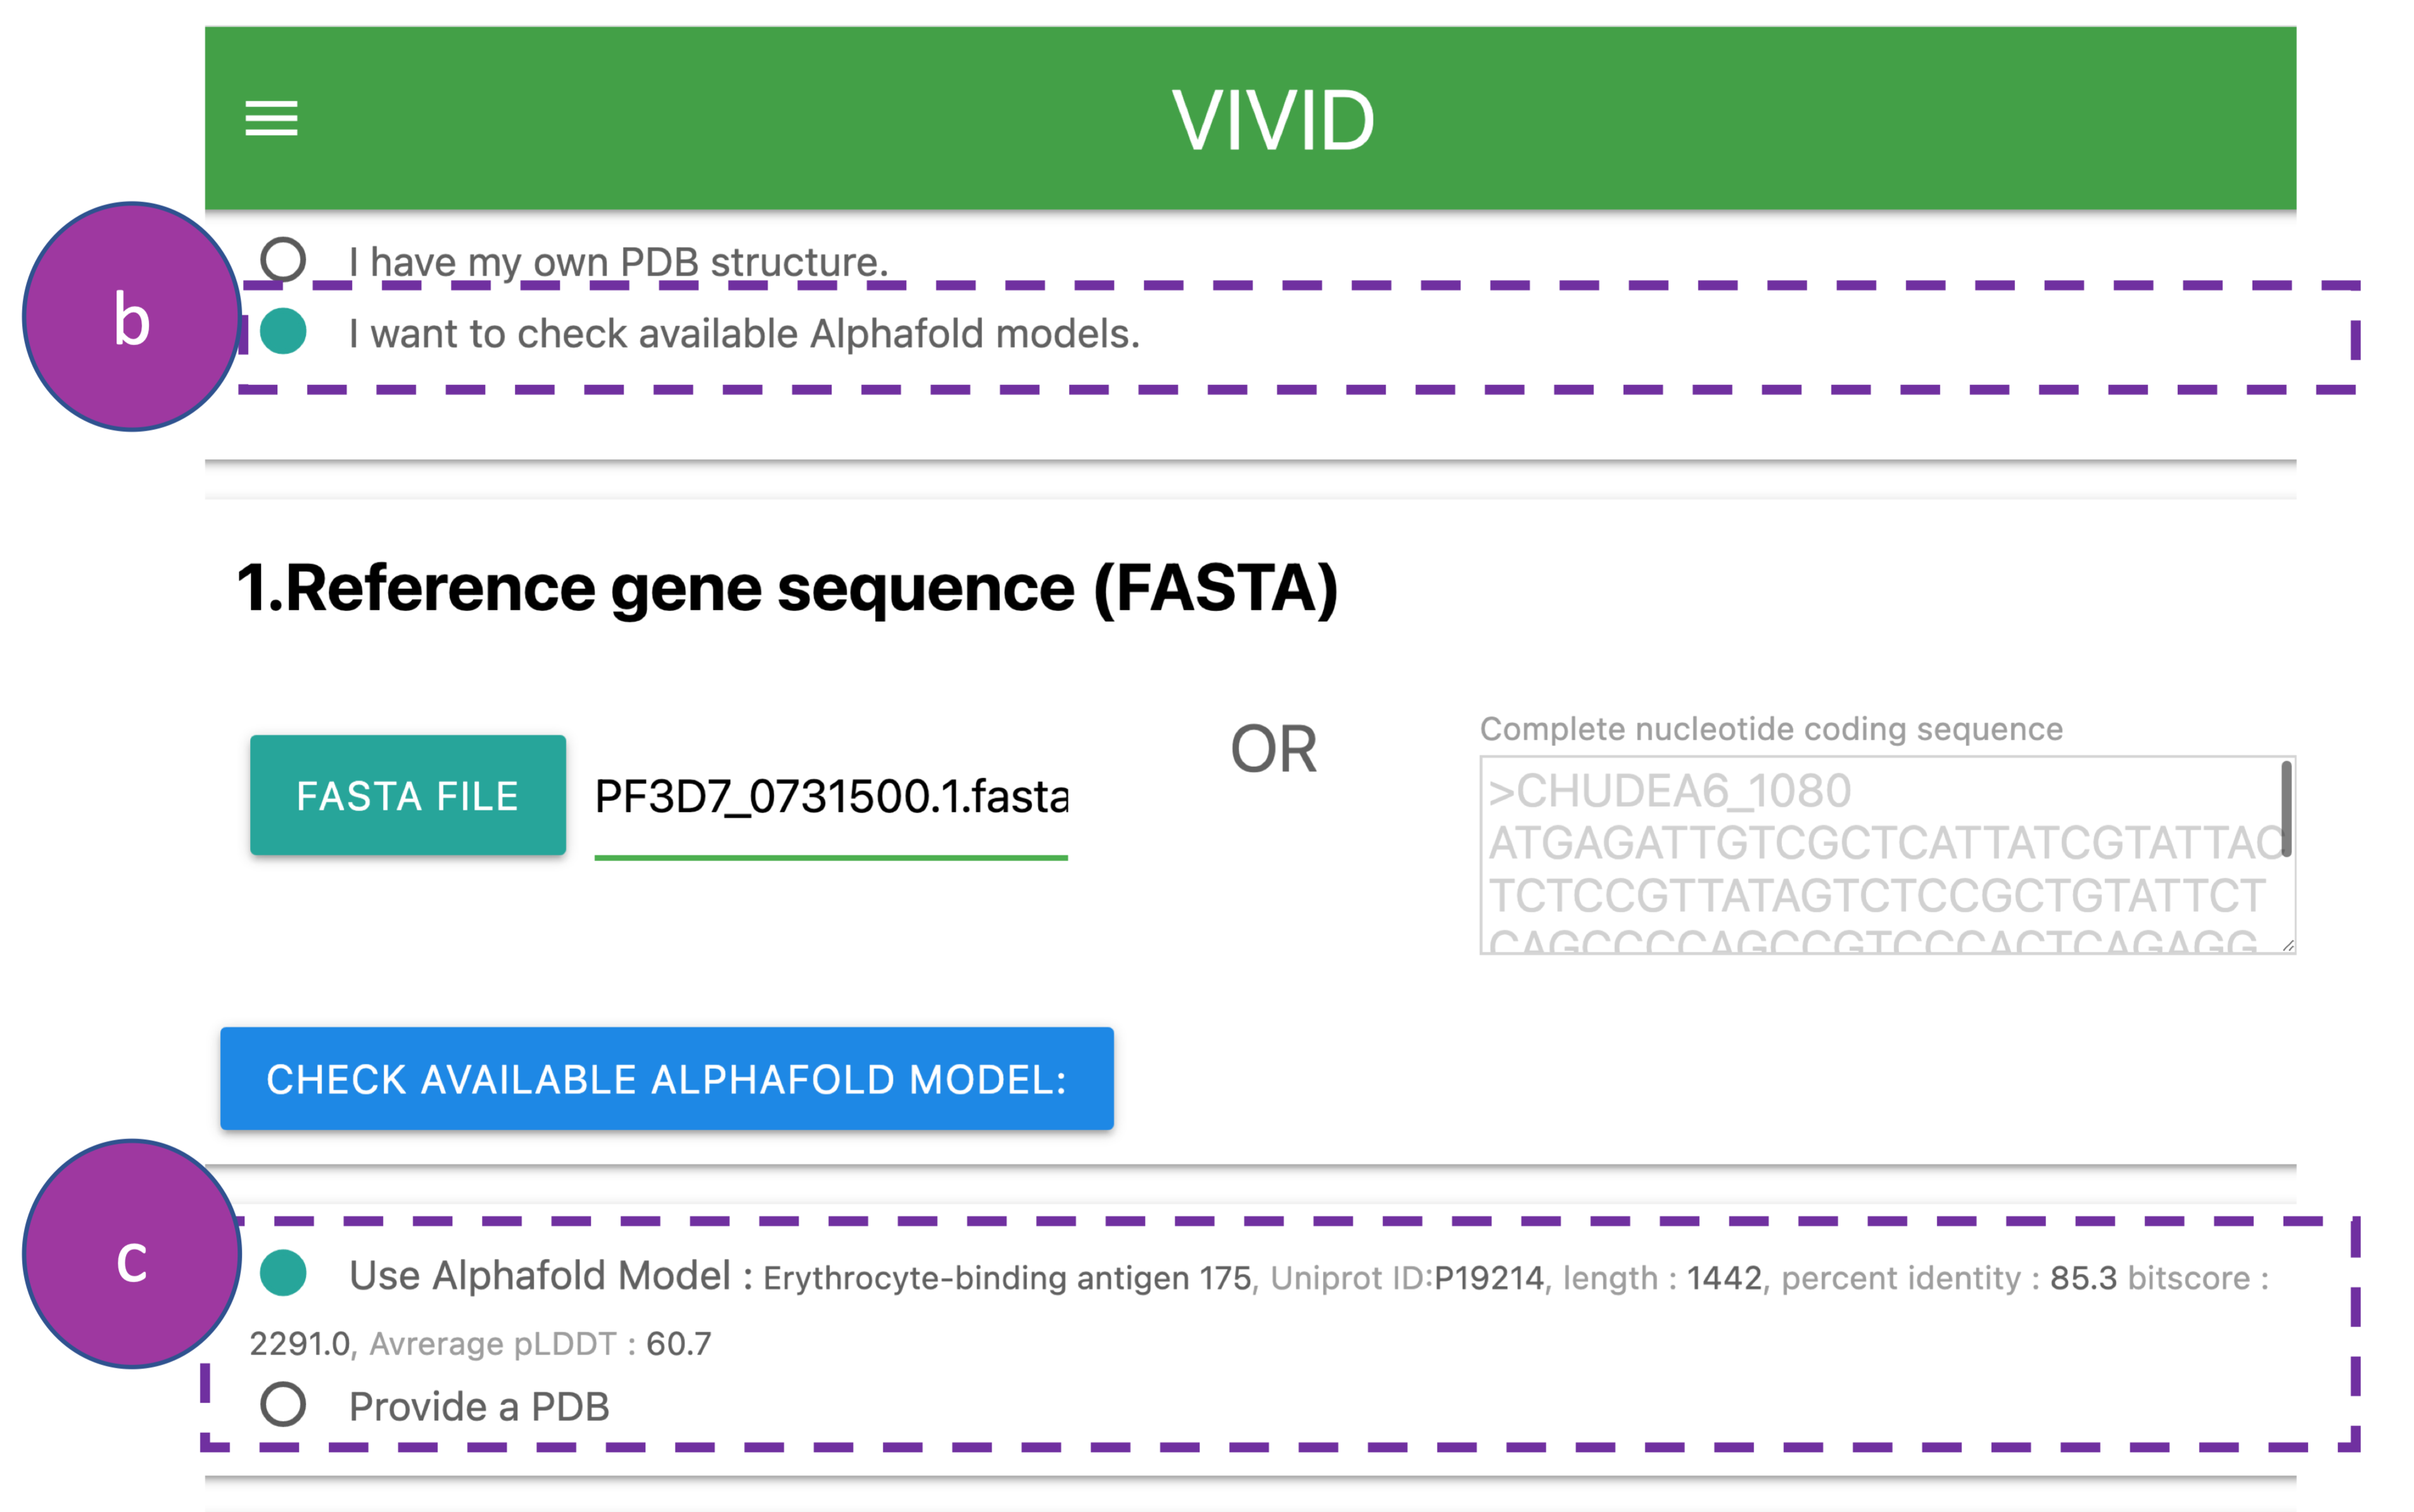
Provide following information:
(b) Request through VIVID to check the availability of a protein structure in the
AlphaFold Protein Structure Database. First, this is done by blasting the query sequence
against
the SWISSPROT database to obtain the UniProt ID of the top blast search hit.
Second, the UniProt ID is then searched in AlphaFold Protein Structure Database to obtain
the
protein structure.
(c) After this search, VIVID provides information such as UniProt ID, sequence
identity,
and average pLDDT score of the model structure to allow the user to decide whether to
proceed
with the analyses.
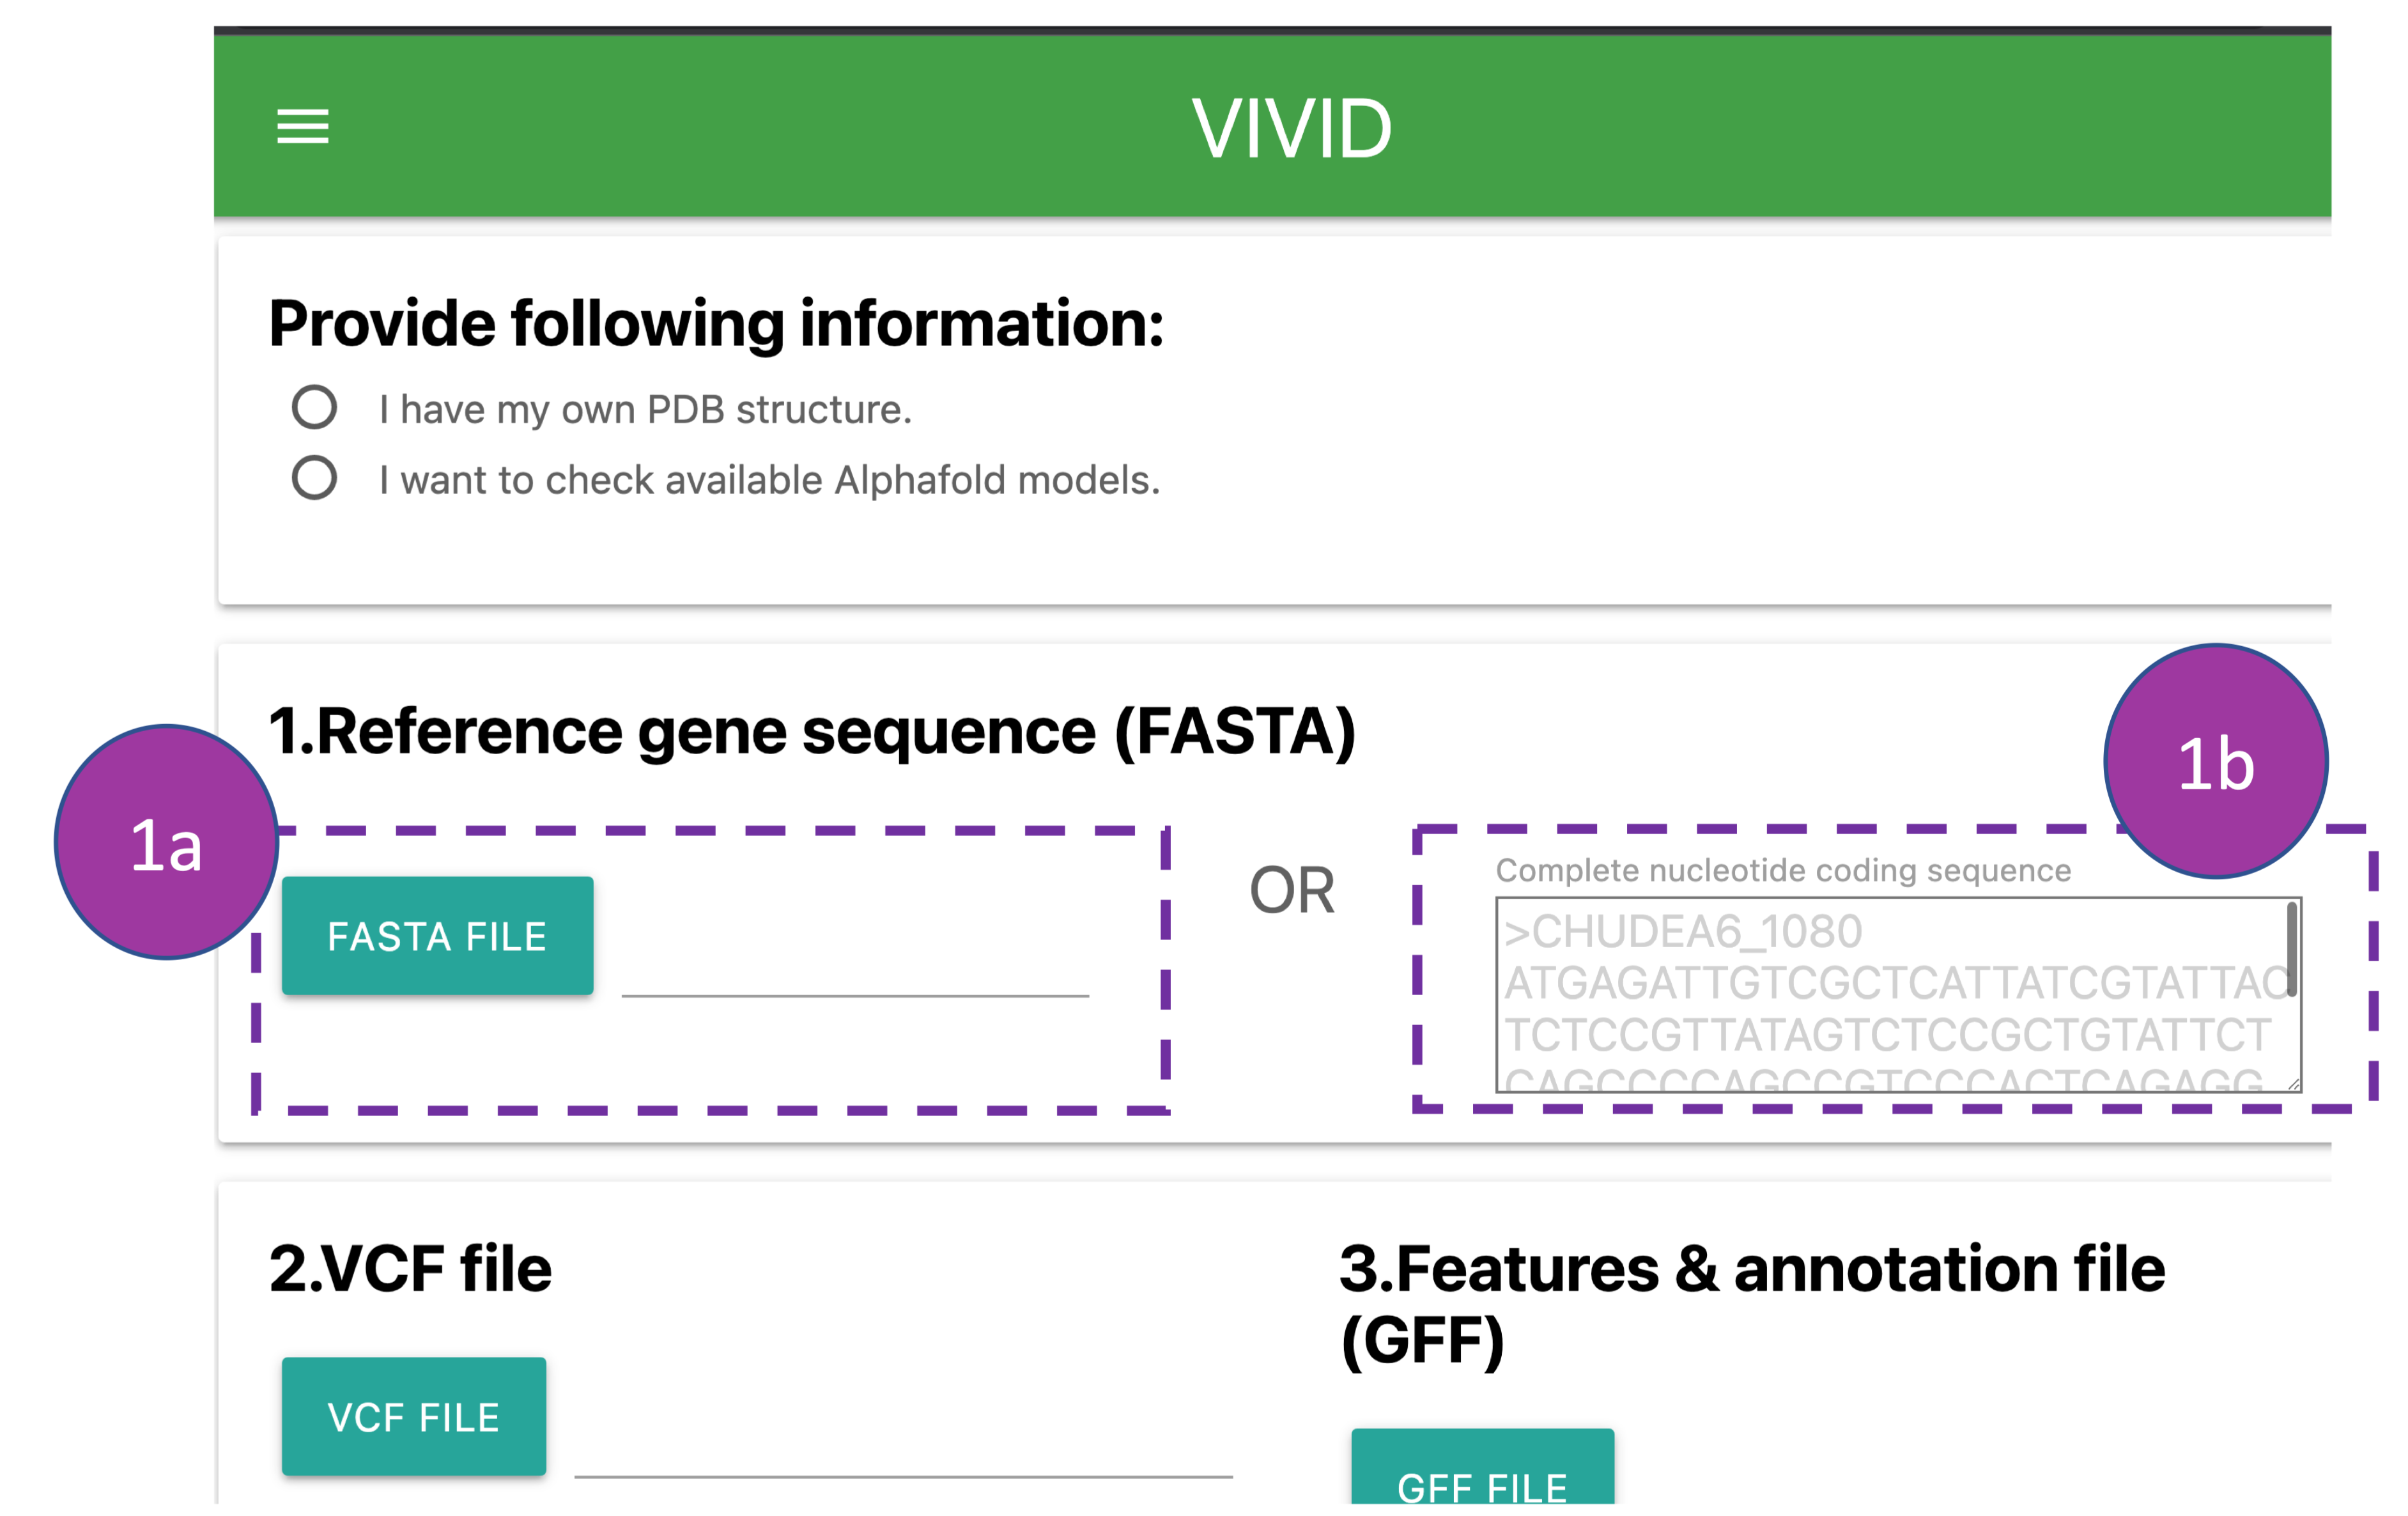
Provide following information:
The complete nucleotide coding sequence of a gene can be provided by either uploading the
FASTA
file from the local system
(1a) or by pasting the sequence along with the gene id into the box (1b).
Please note:
The header in a FASTA file should contain only '>gene_id' without any additional information
such as delimiters
('|','space','tab',etc) or annotation (1b).
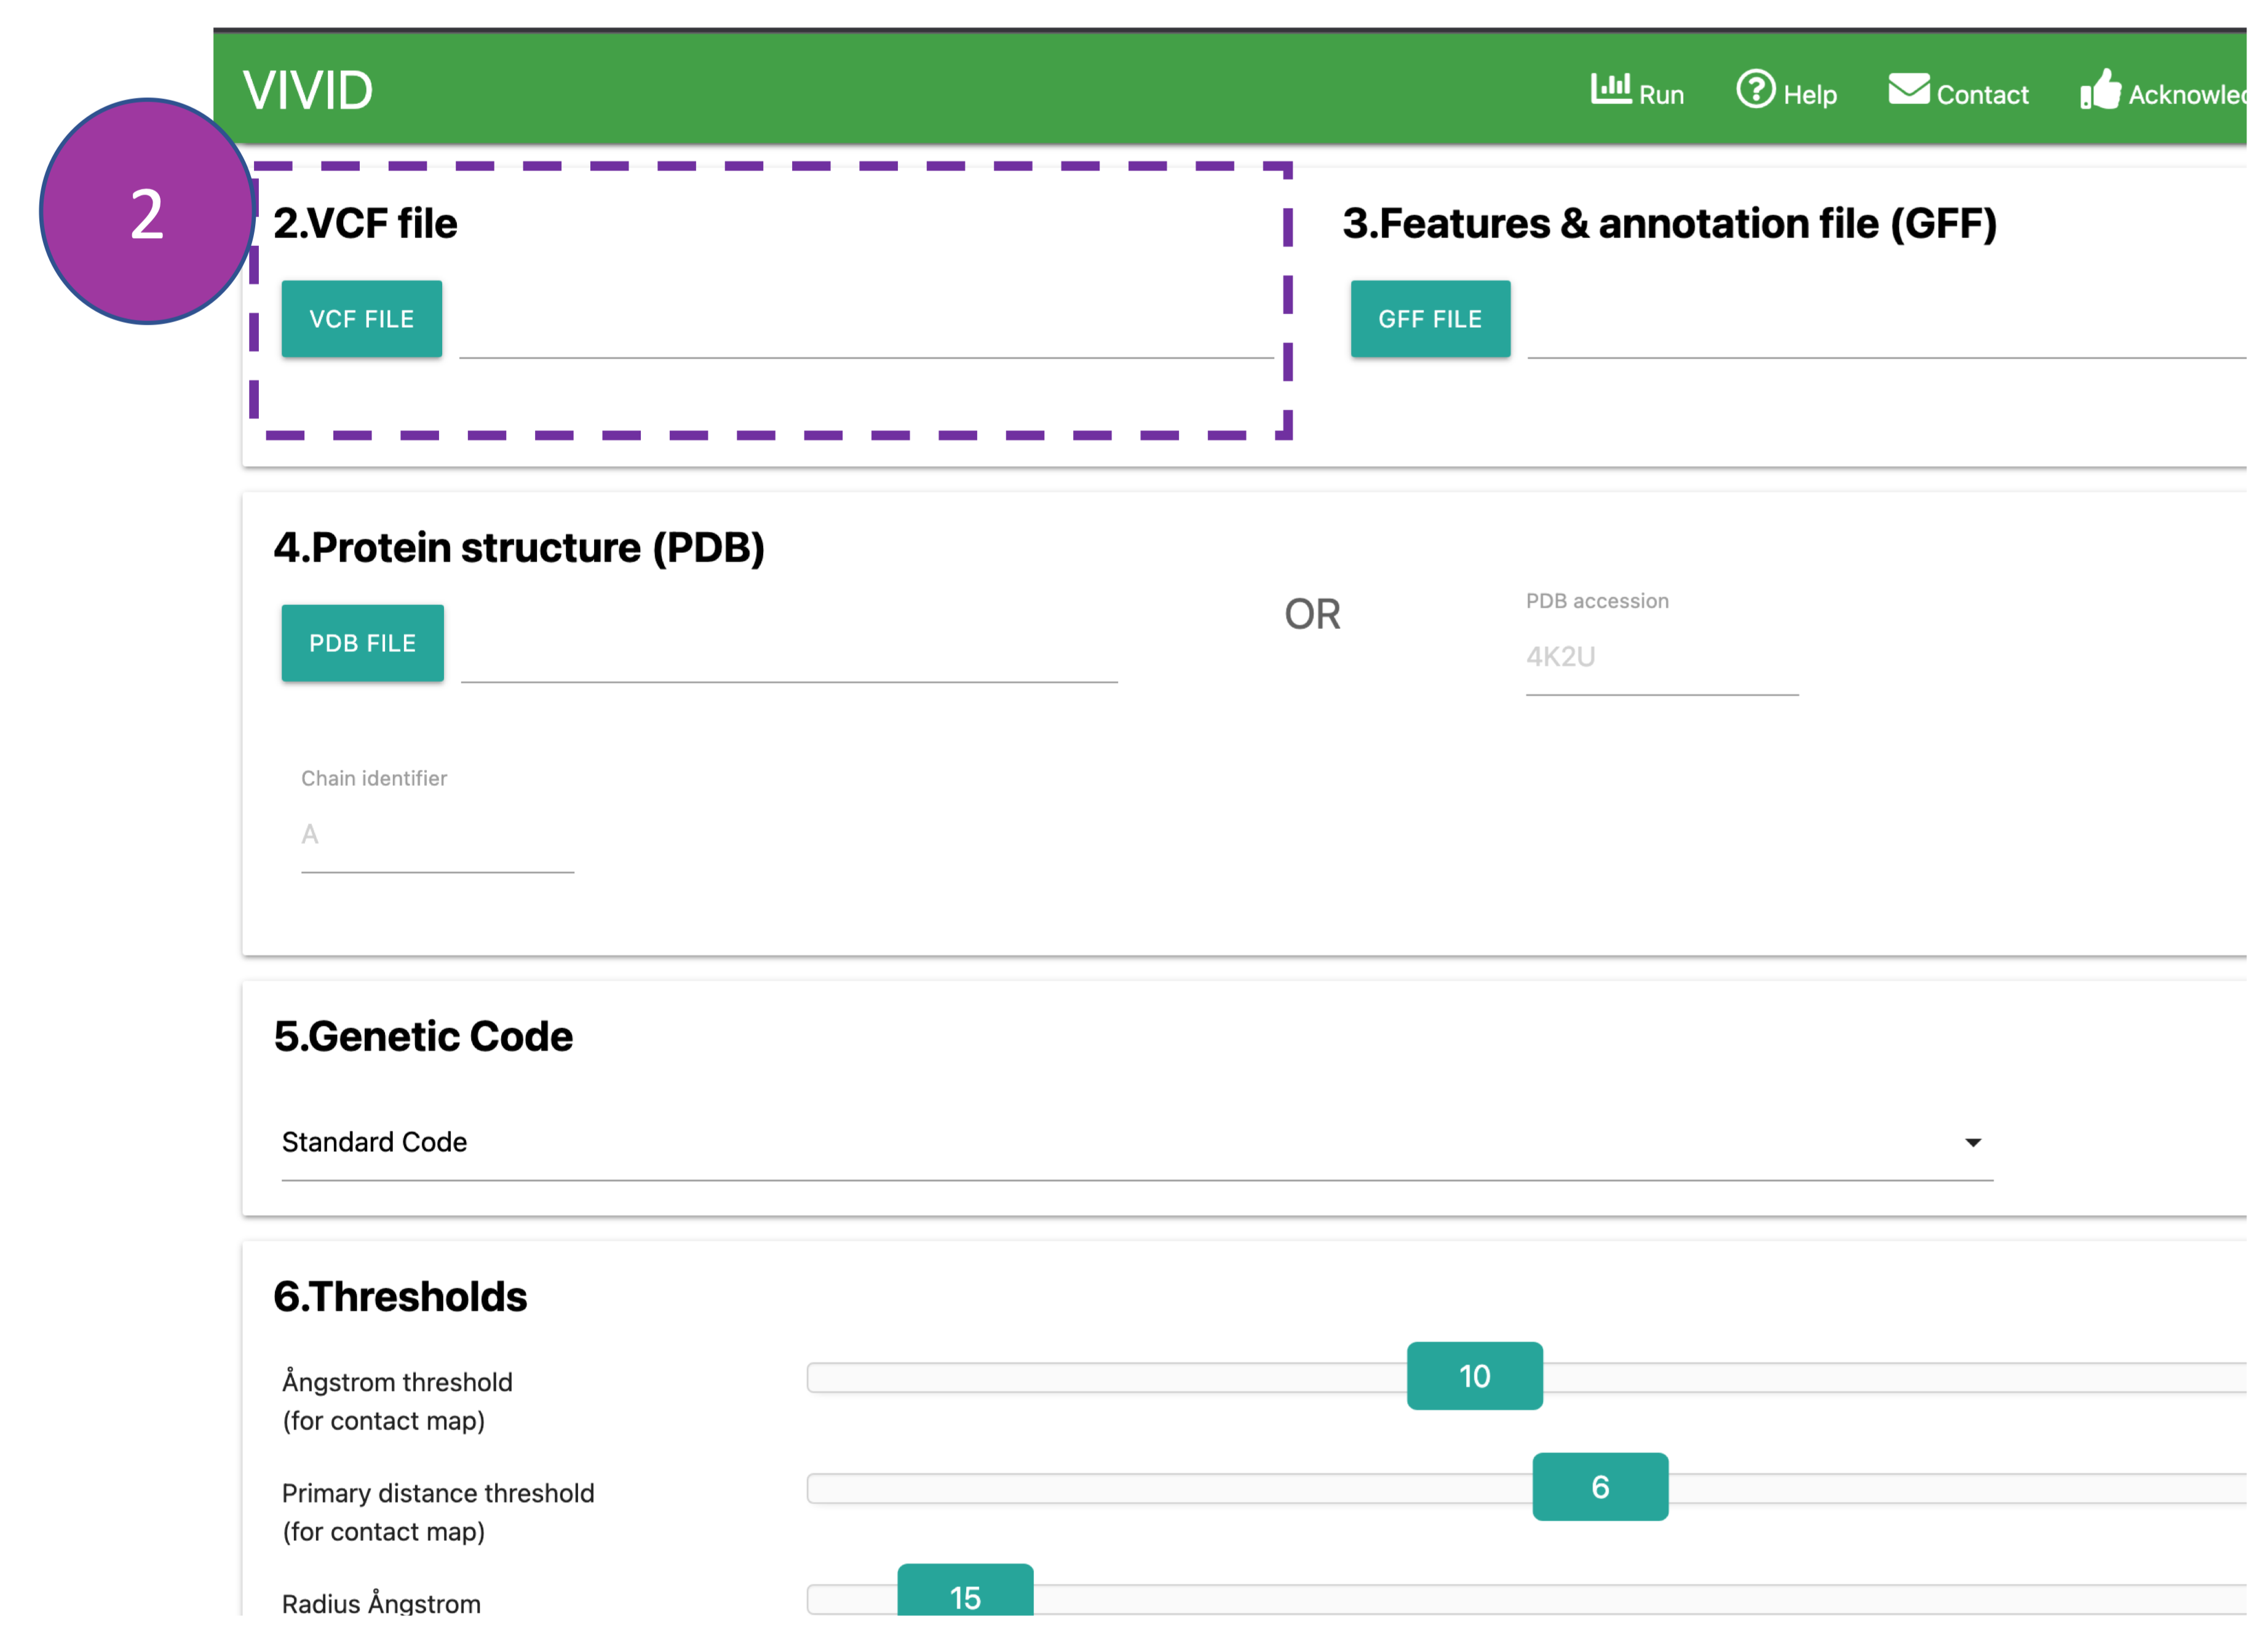
VCF file
Provide a VCF file that contains only bi-allelic SNPs. If the VCF file size is large (> 500
MB),
we suggest users to
reduce the file size by selecting/keeping SNPs specific to the coding region of the query
sequence to avoid lengthy processing times.
If the VCF file is unavilable, SNP information can also be provided in a tabular format (download example VCF
file).
Please note:
The nucleotide coding sequence should be from the same version of the reference genome used
to
call SNPs.
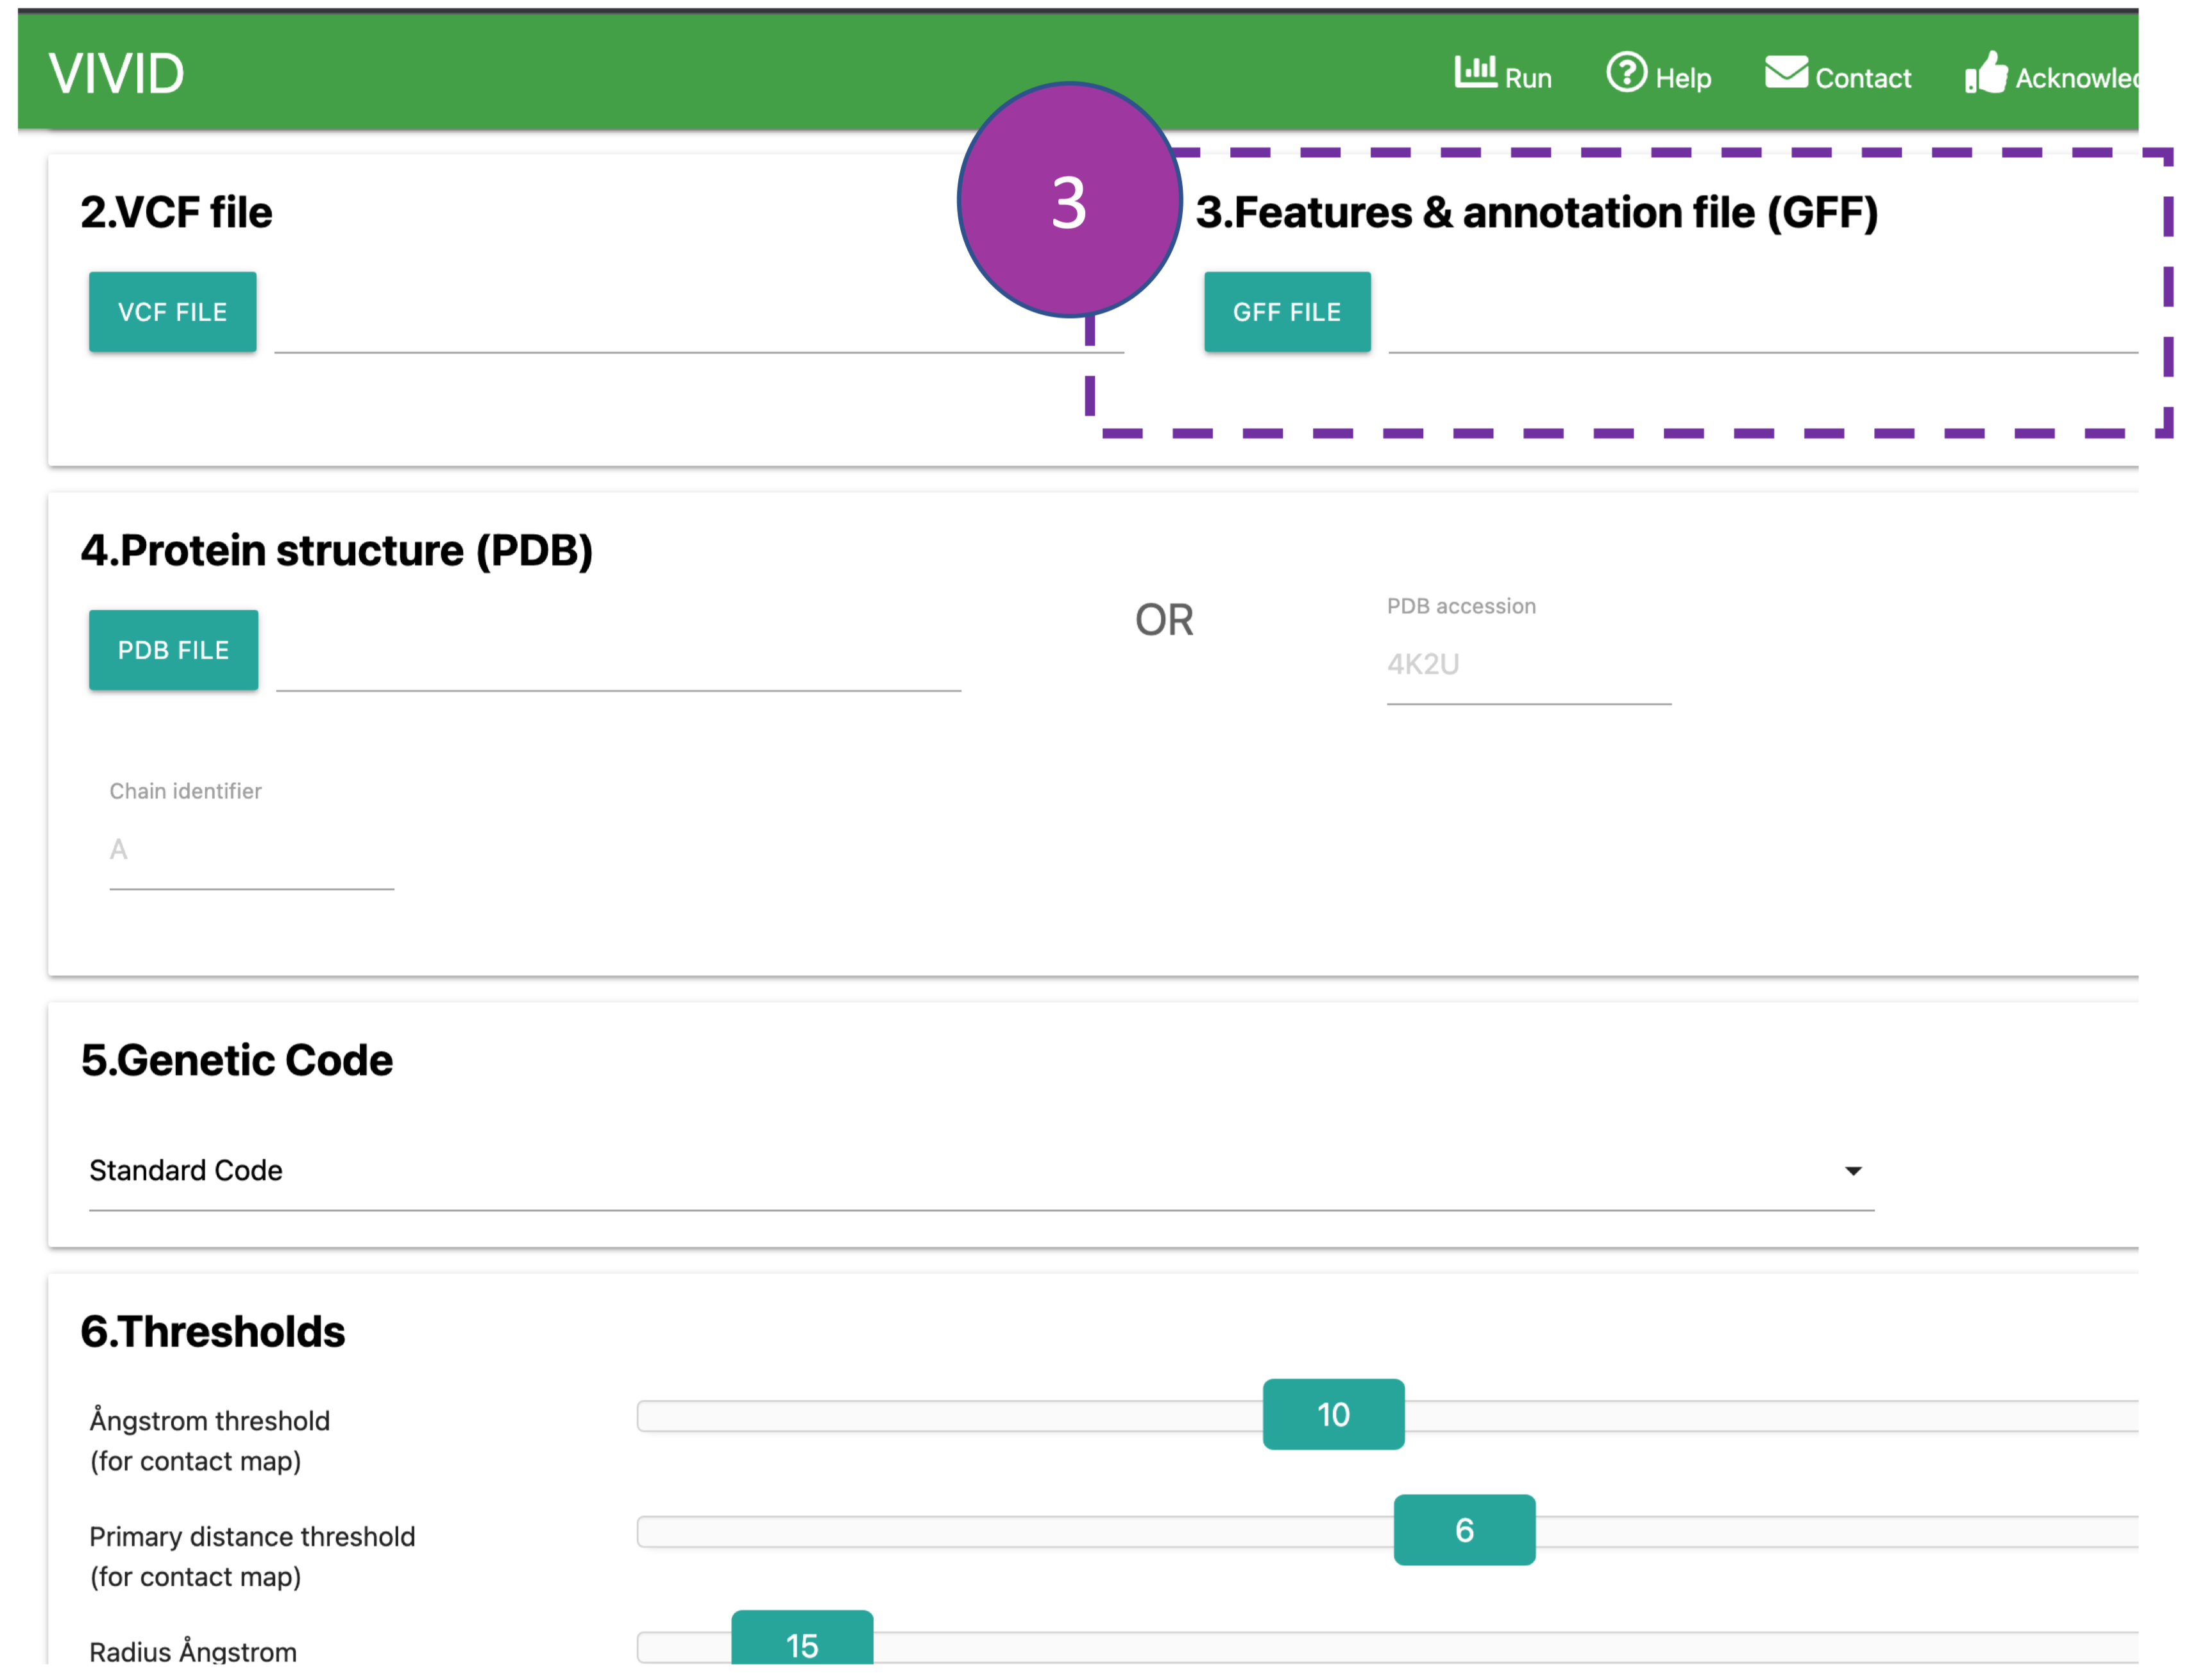
GFF file
Provide a GFF annotation file that should contain the "CDS" feature. If the GFF file is
unavailable,
CDS coordinates can also be provided in tabular format (download example GFF
file).
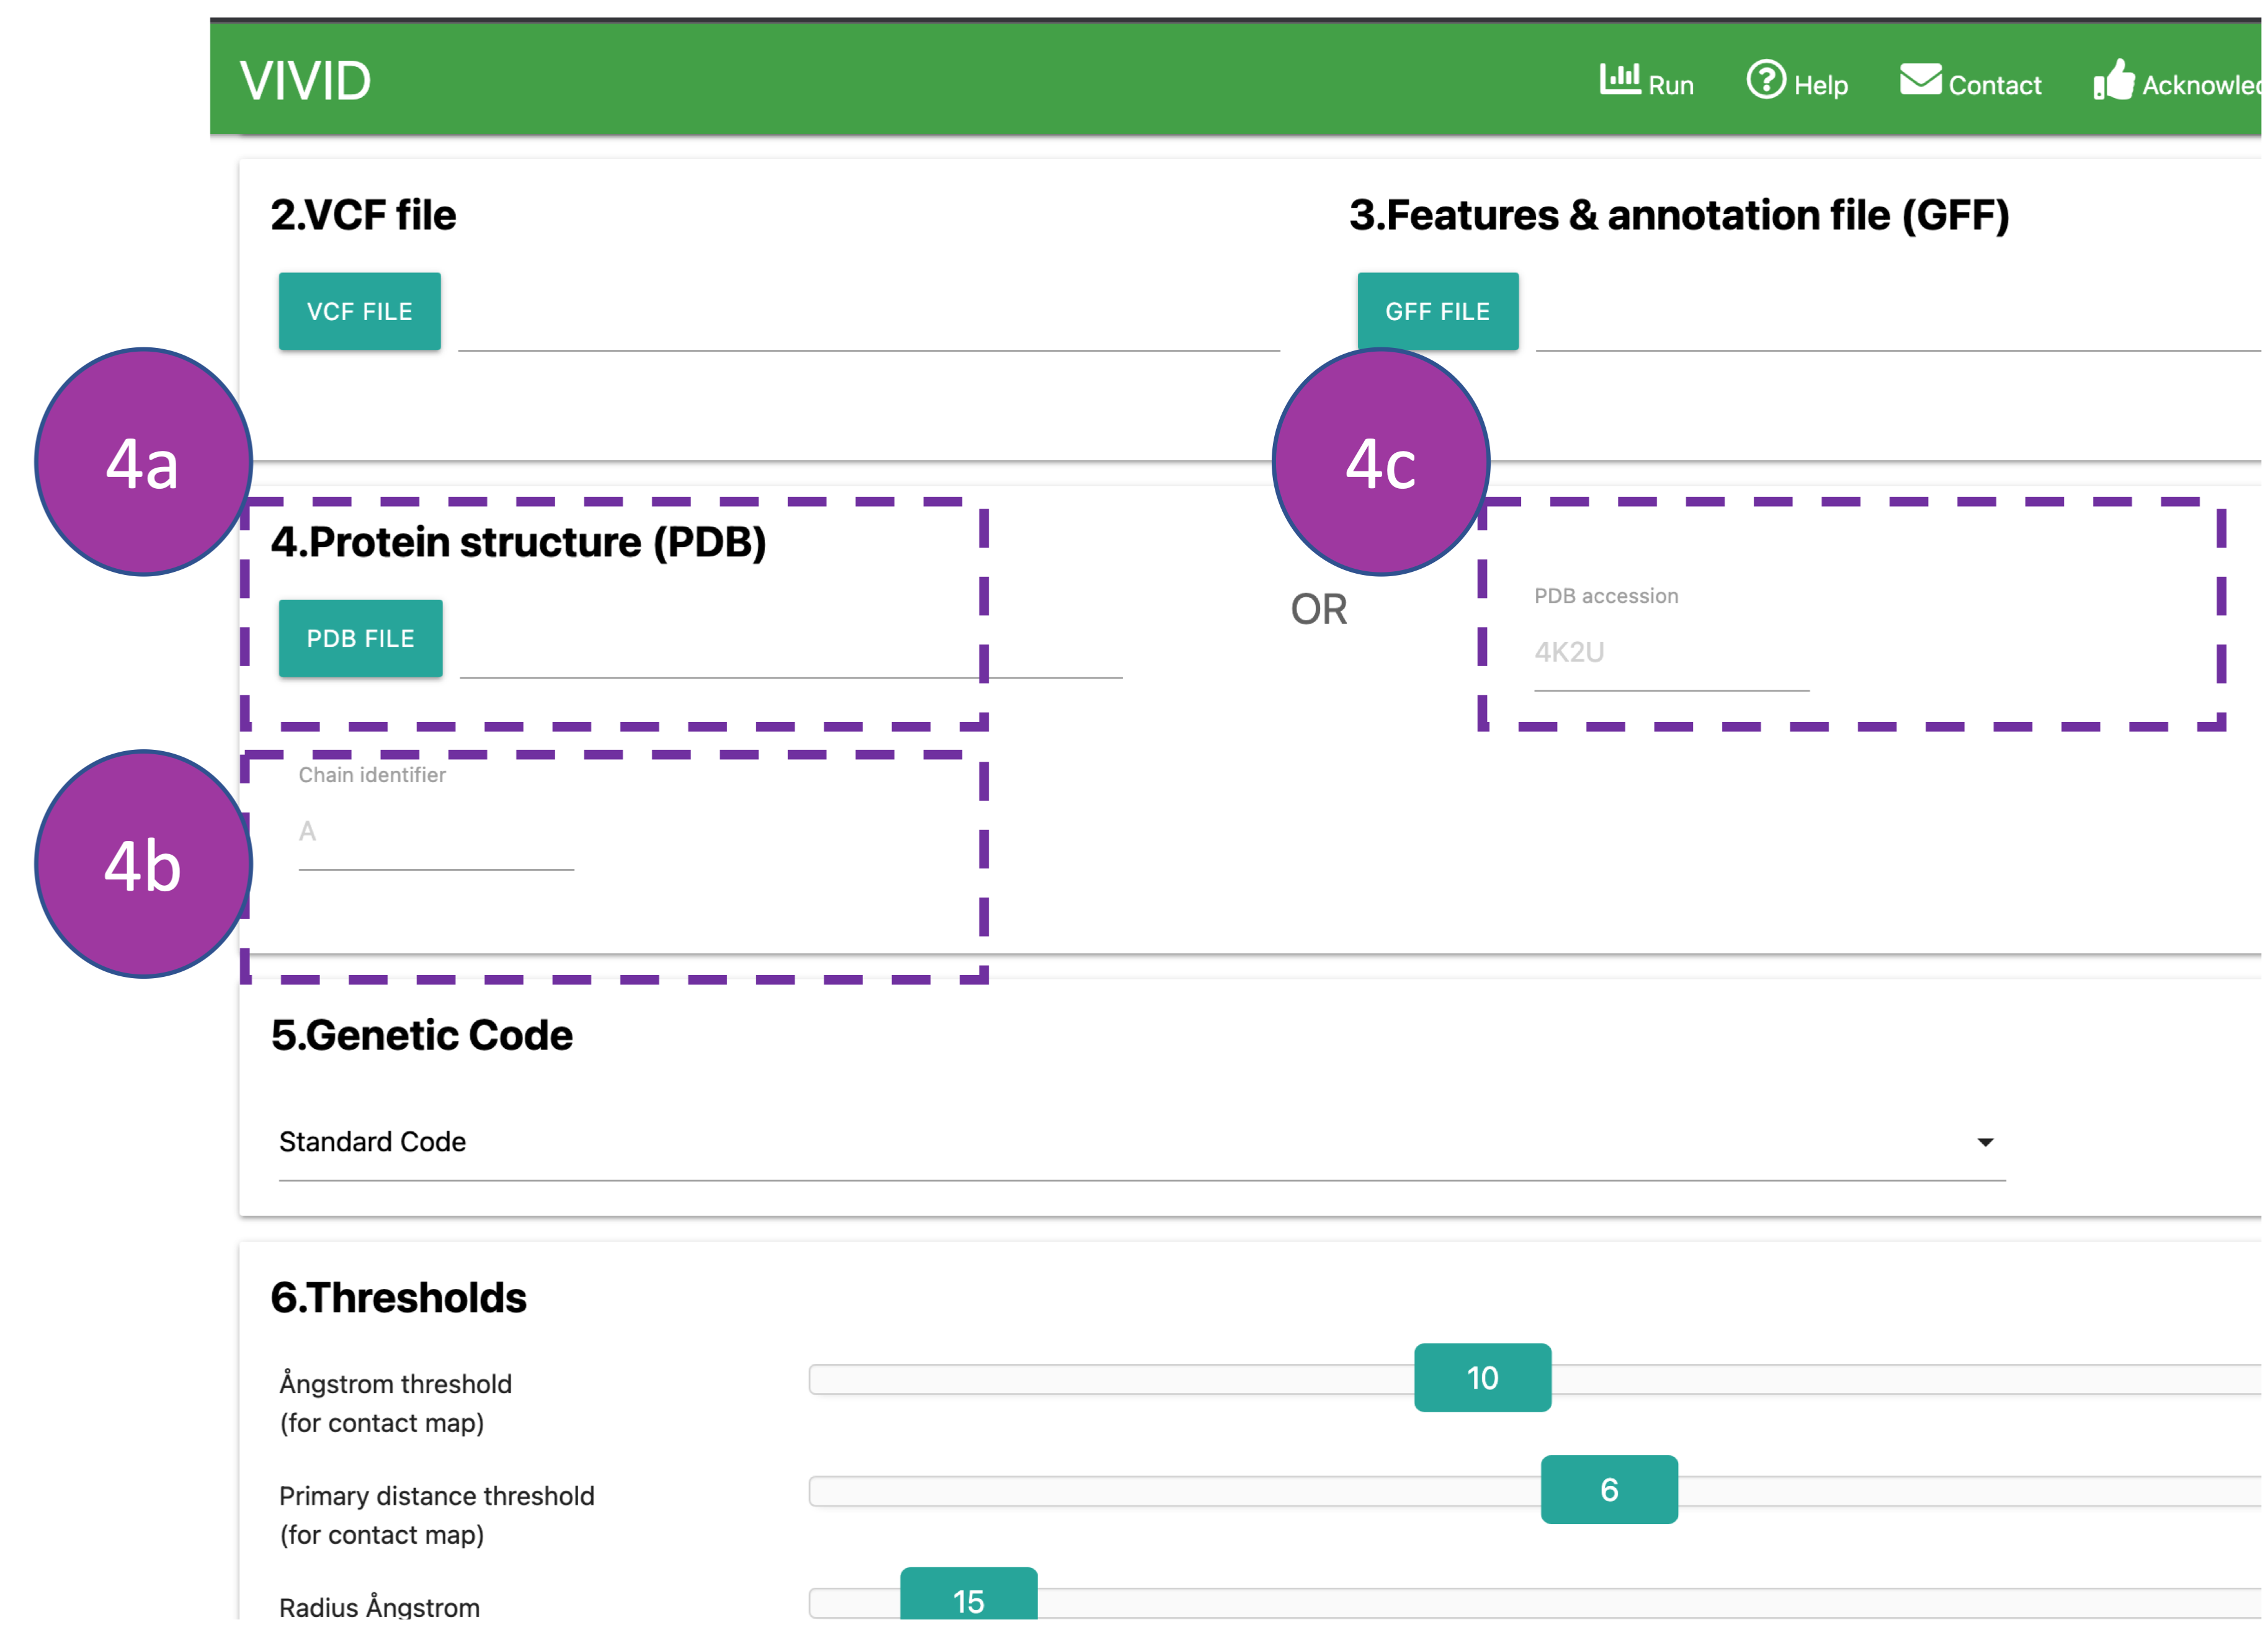
Protein structure (PDB)
Provide a protein structure file (4a or 4c) and chain ID (4b) if you have your
PDB
structure.
This can be provided by either uploading a PDB file from the local system (4a) or
accessing it via the RCSB PDB
by providing a PDB ID (4c).
These details will be auto-filled if AlphaFold models are selected at the beginning.
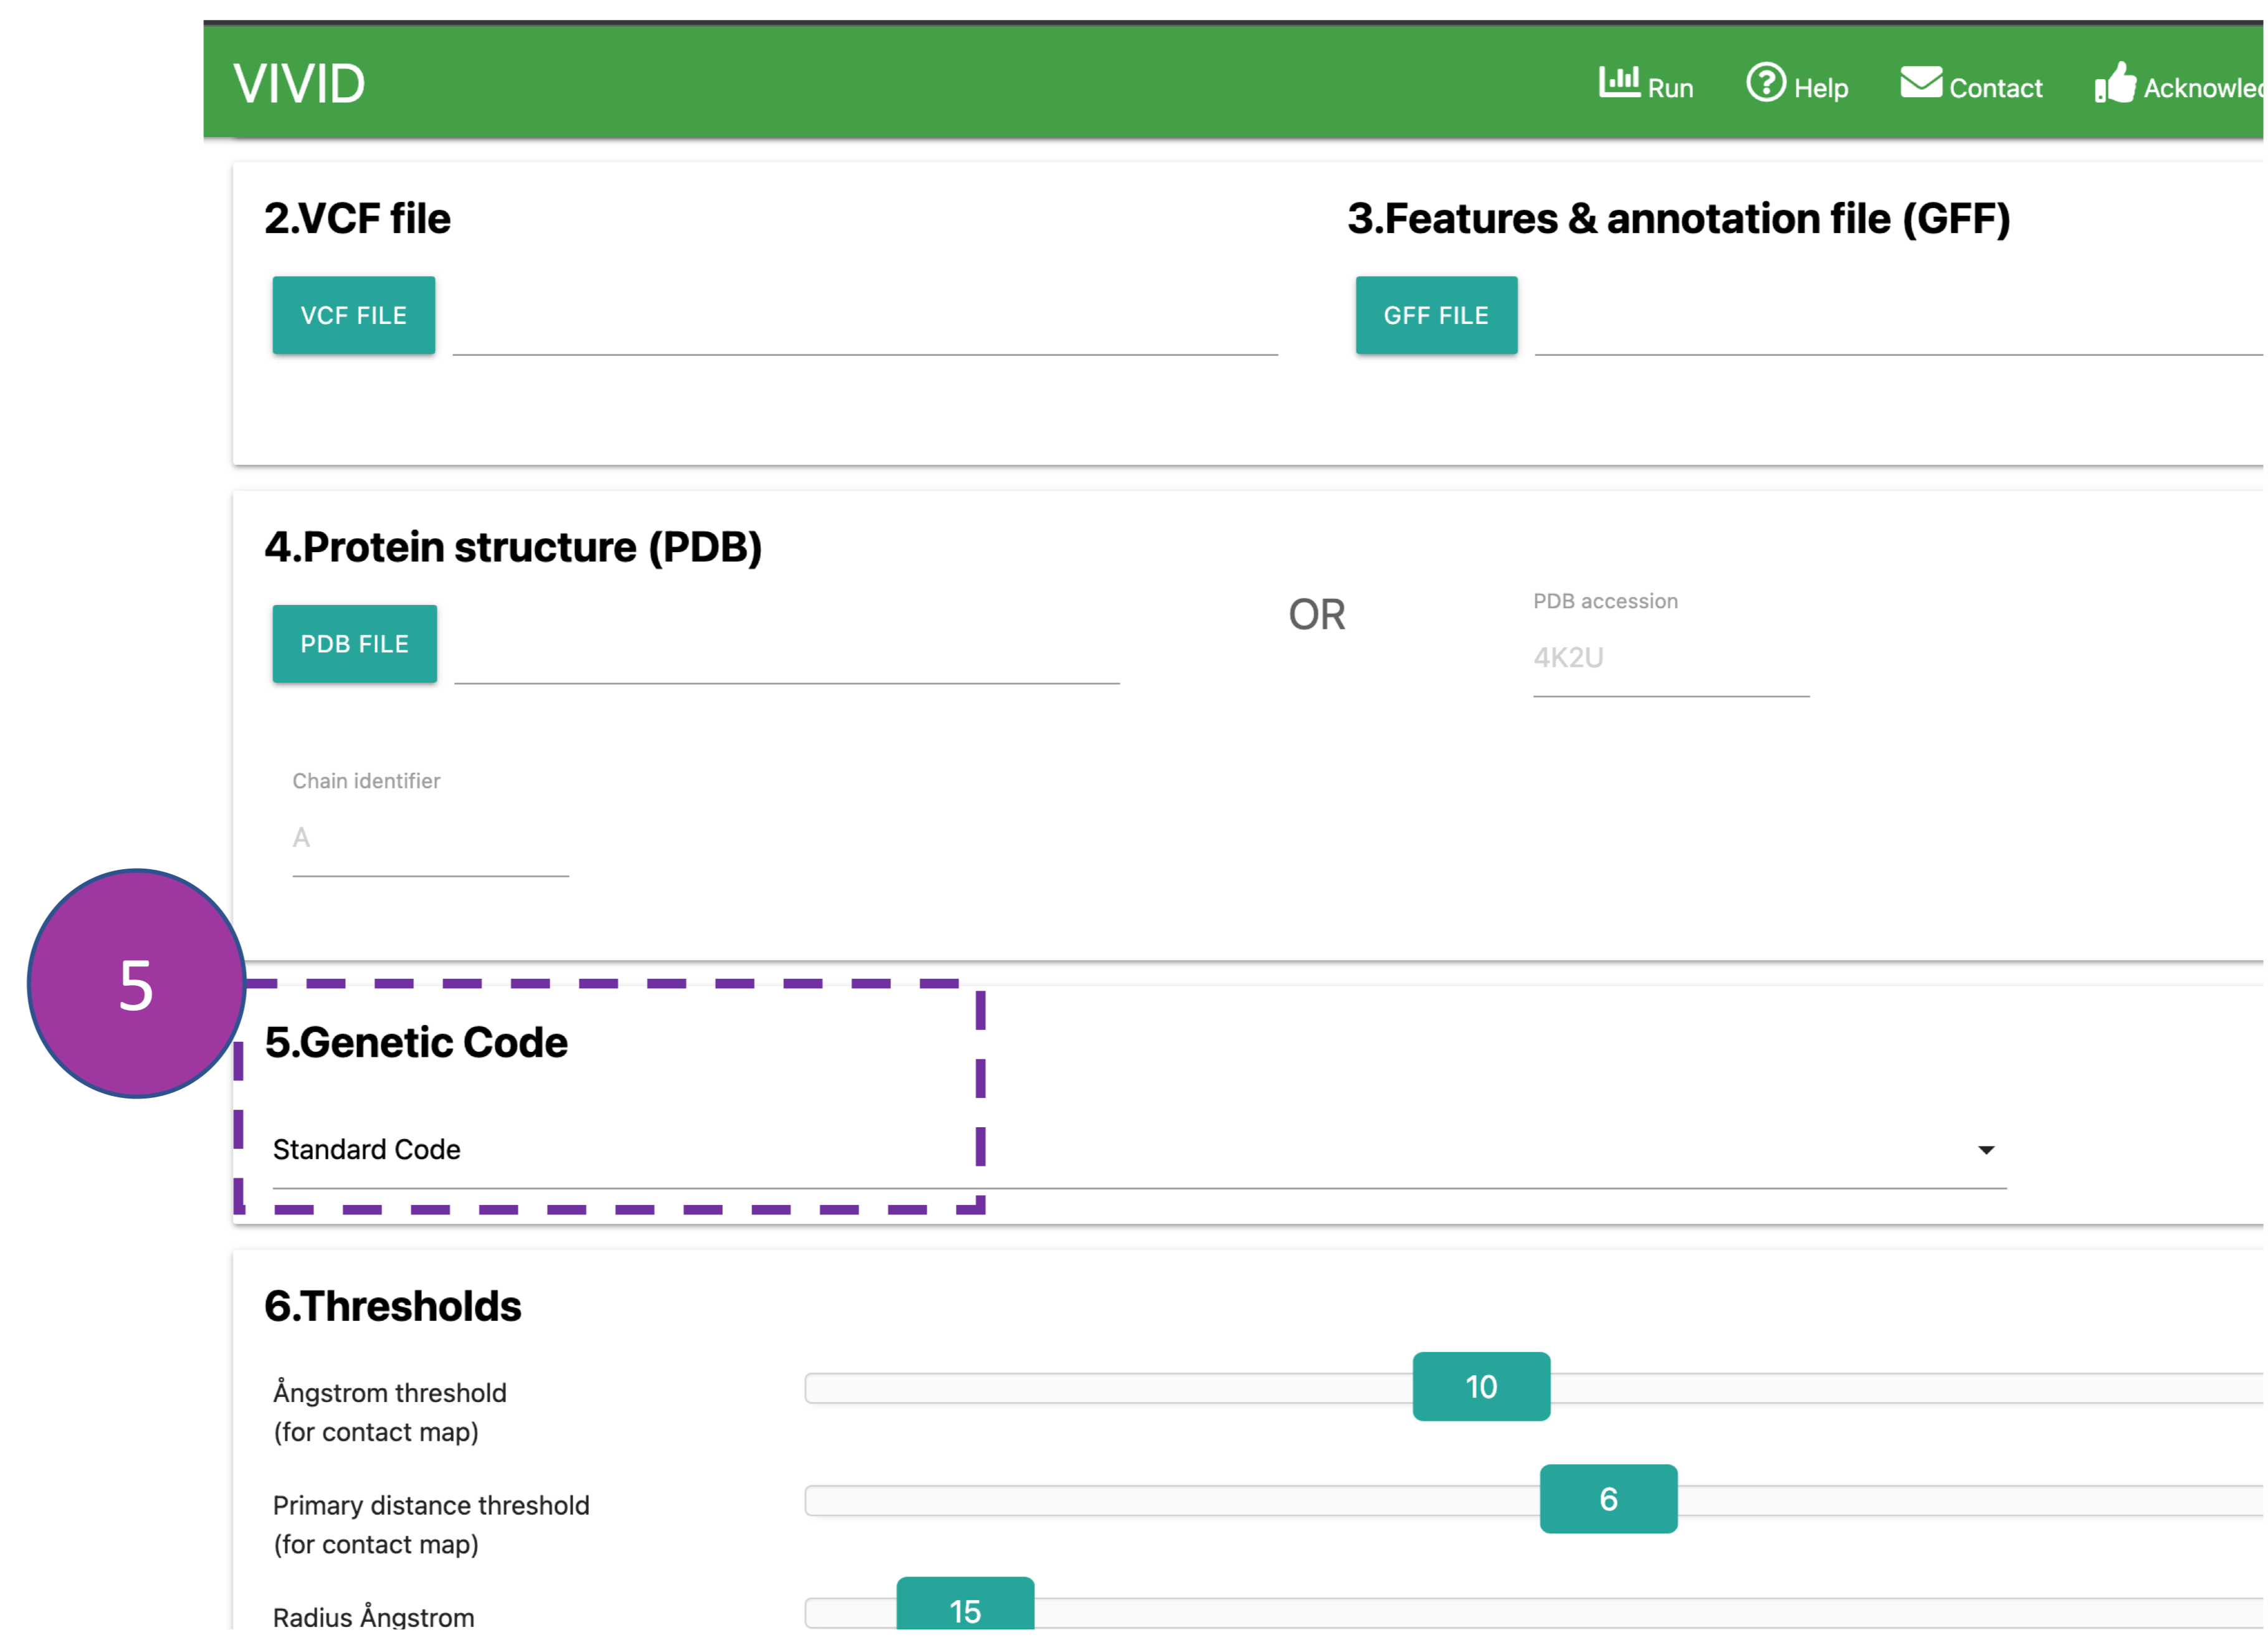
Genetic code
Select the appropriate genetic code (default: 'Standard Code') from the drop-down menu used
to
translate queried coding sequence into amino acids.
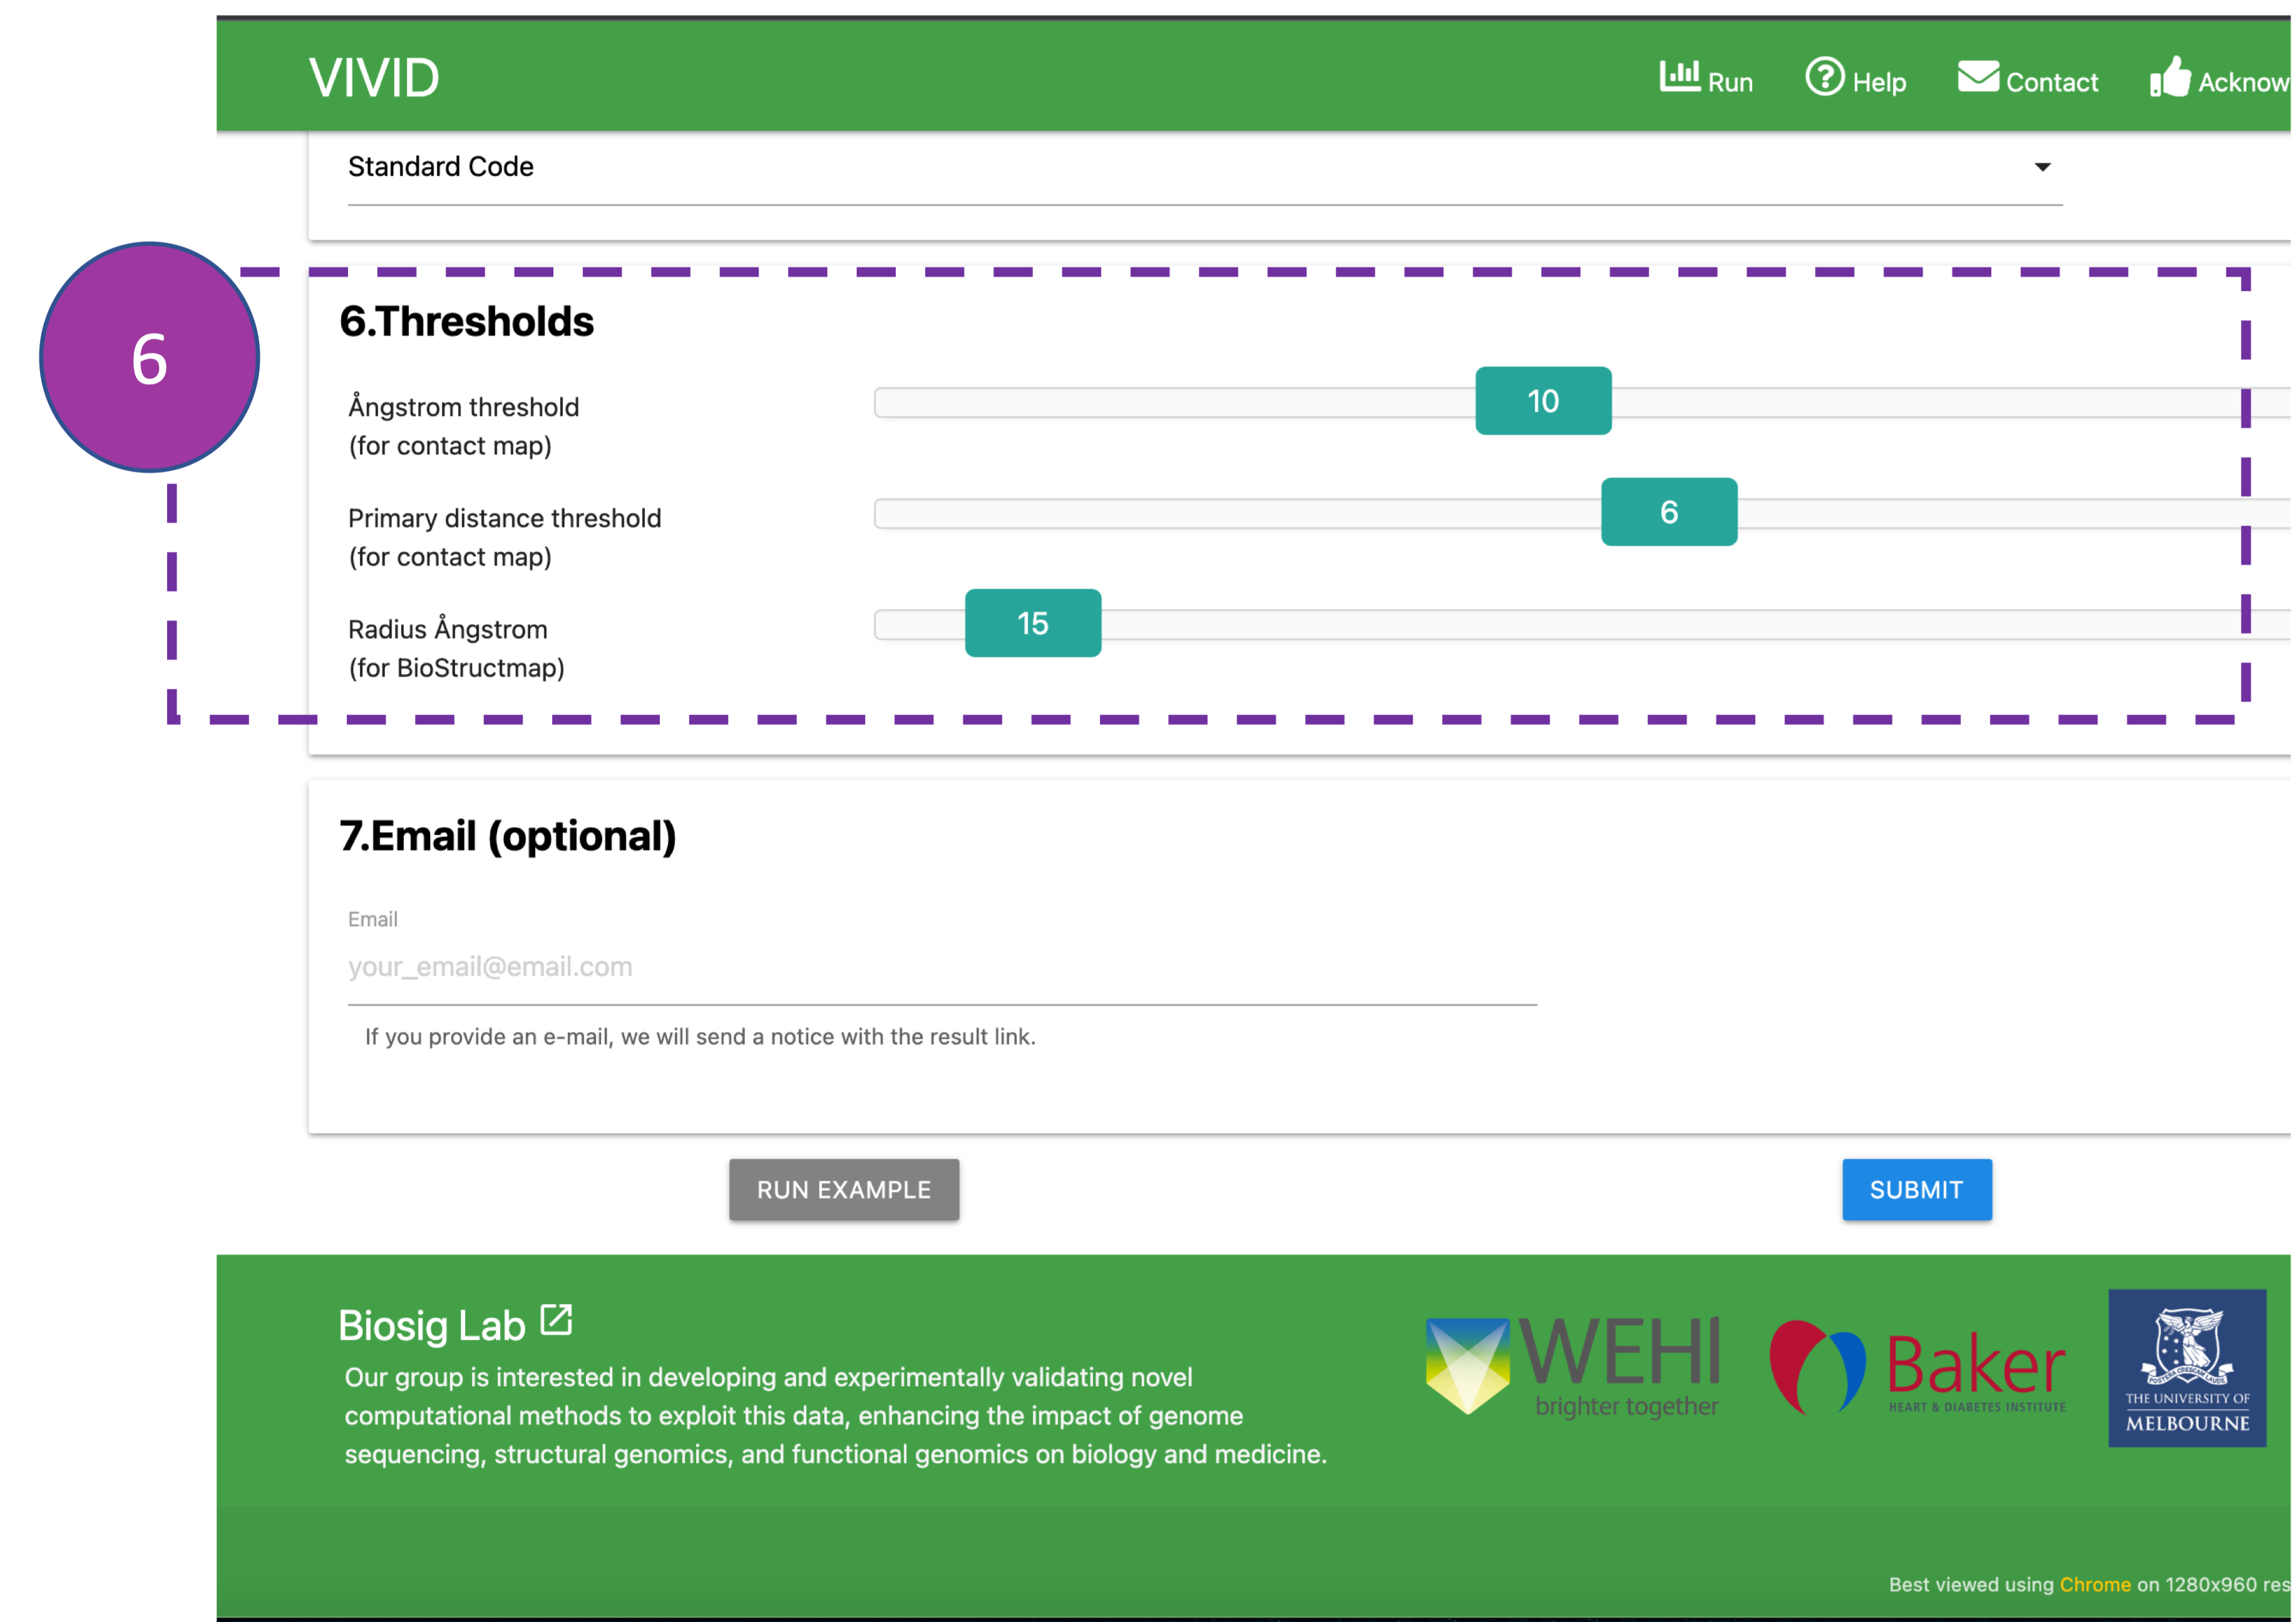
Thresholds
These inputs are optional and are associated with "Contact Map" and "BioStructmap" analyses
that
display pairwise residue interactions and perform 3D
sliding window population genetics analyses. Ångstrom (0.1 nm) is the standard unit of
measurement for protein crystal structures.
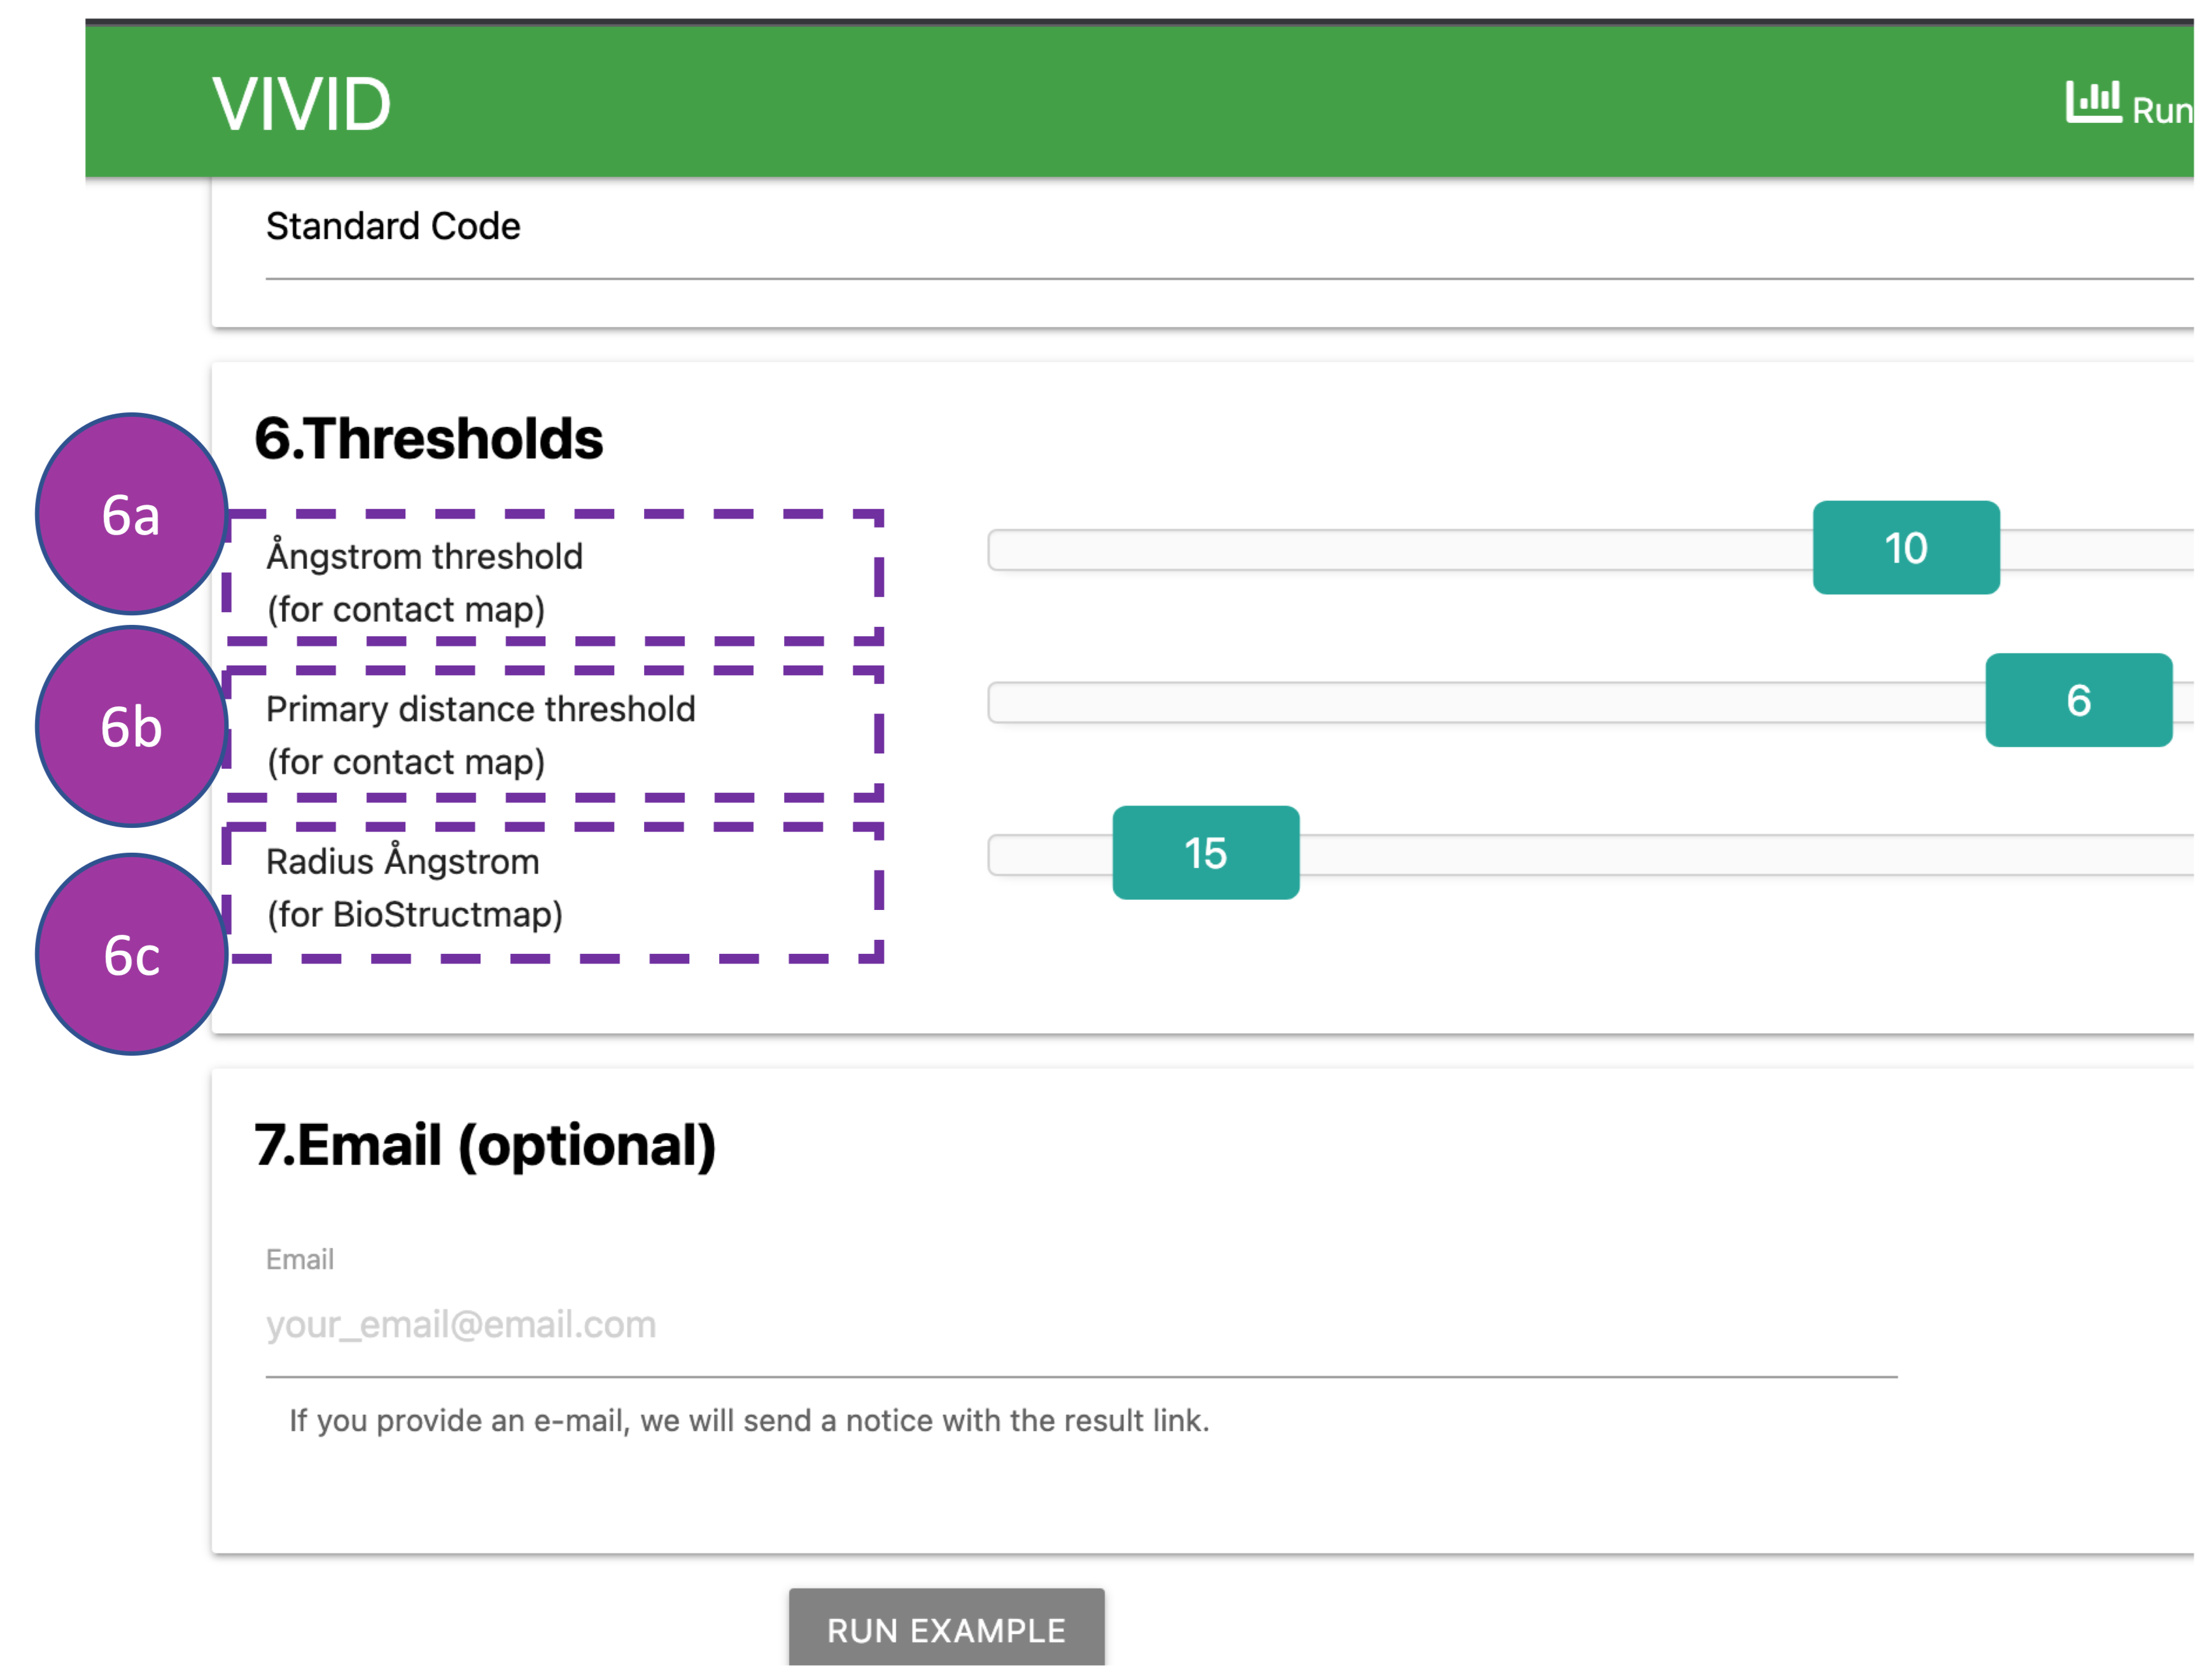
Thresholds
Here, the Ångstrom threshold (6a) indicates the Euclidian distance in 3D space
between
alpha
carbon atoms of amoni acids (default: 10 Å) in the contact map.
The primary distance threshold (6b) represents the number of amino acids apart in the
primary
sequence (default: 6 amino acids) in the contact map.
Radius Ångstrom (6c) represents Euclidian distance from the alpha carbon atoms of
mutated
residues (default: 15 Å), for which 3D sliding window population
genetic analyses will be performed.
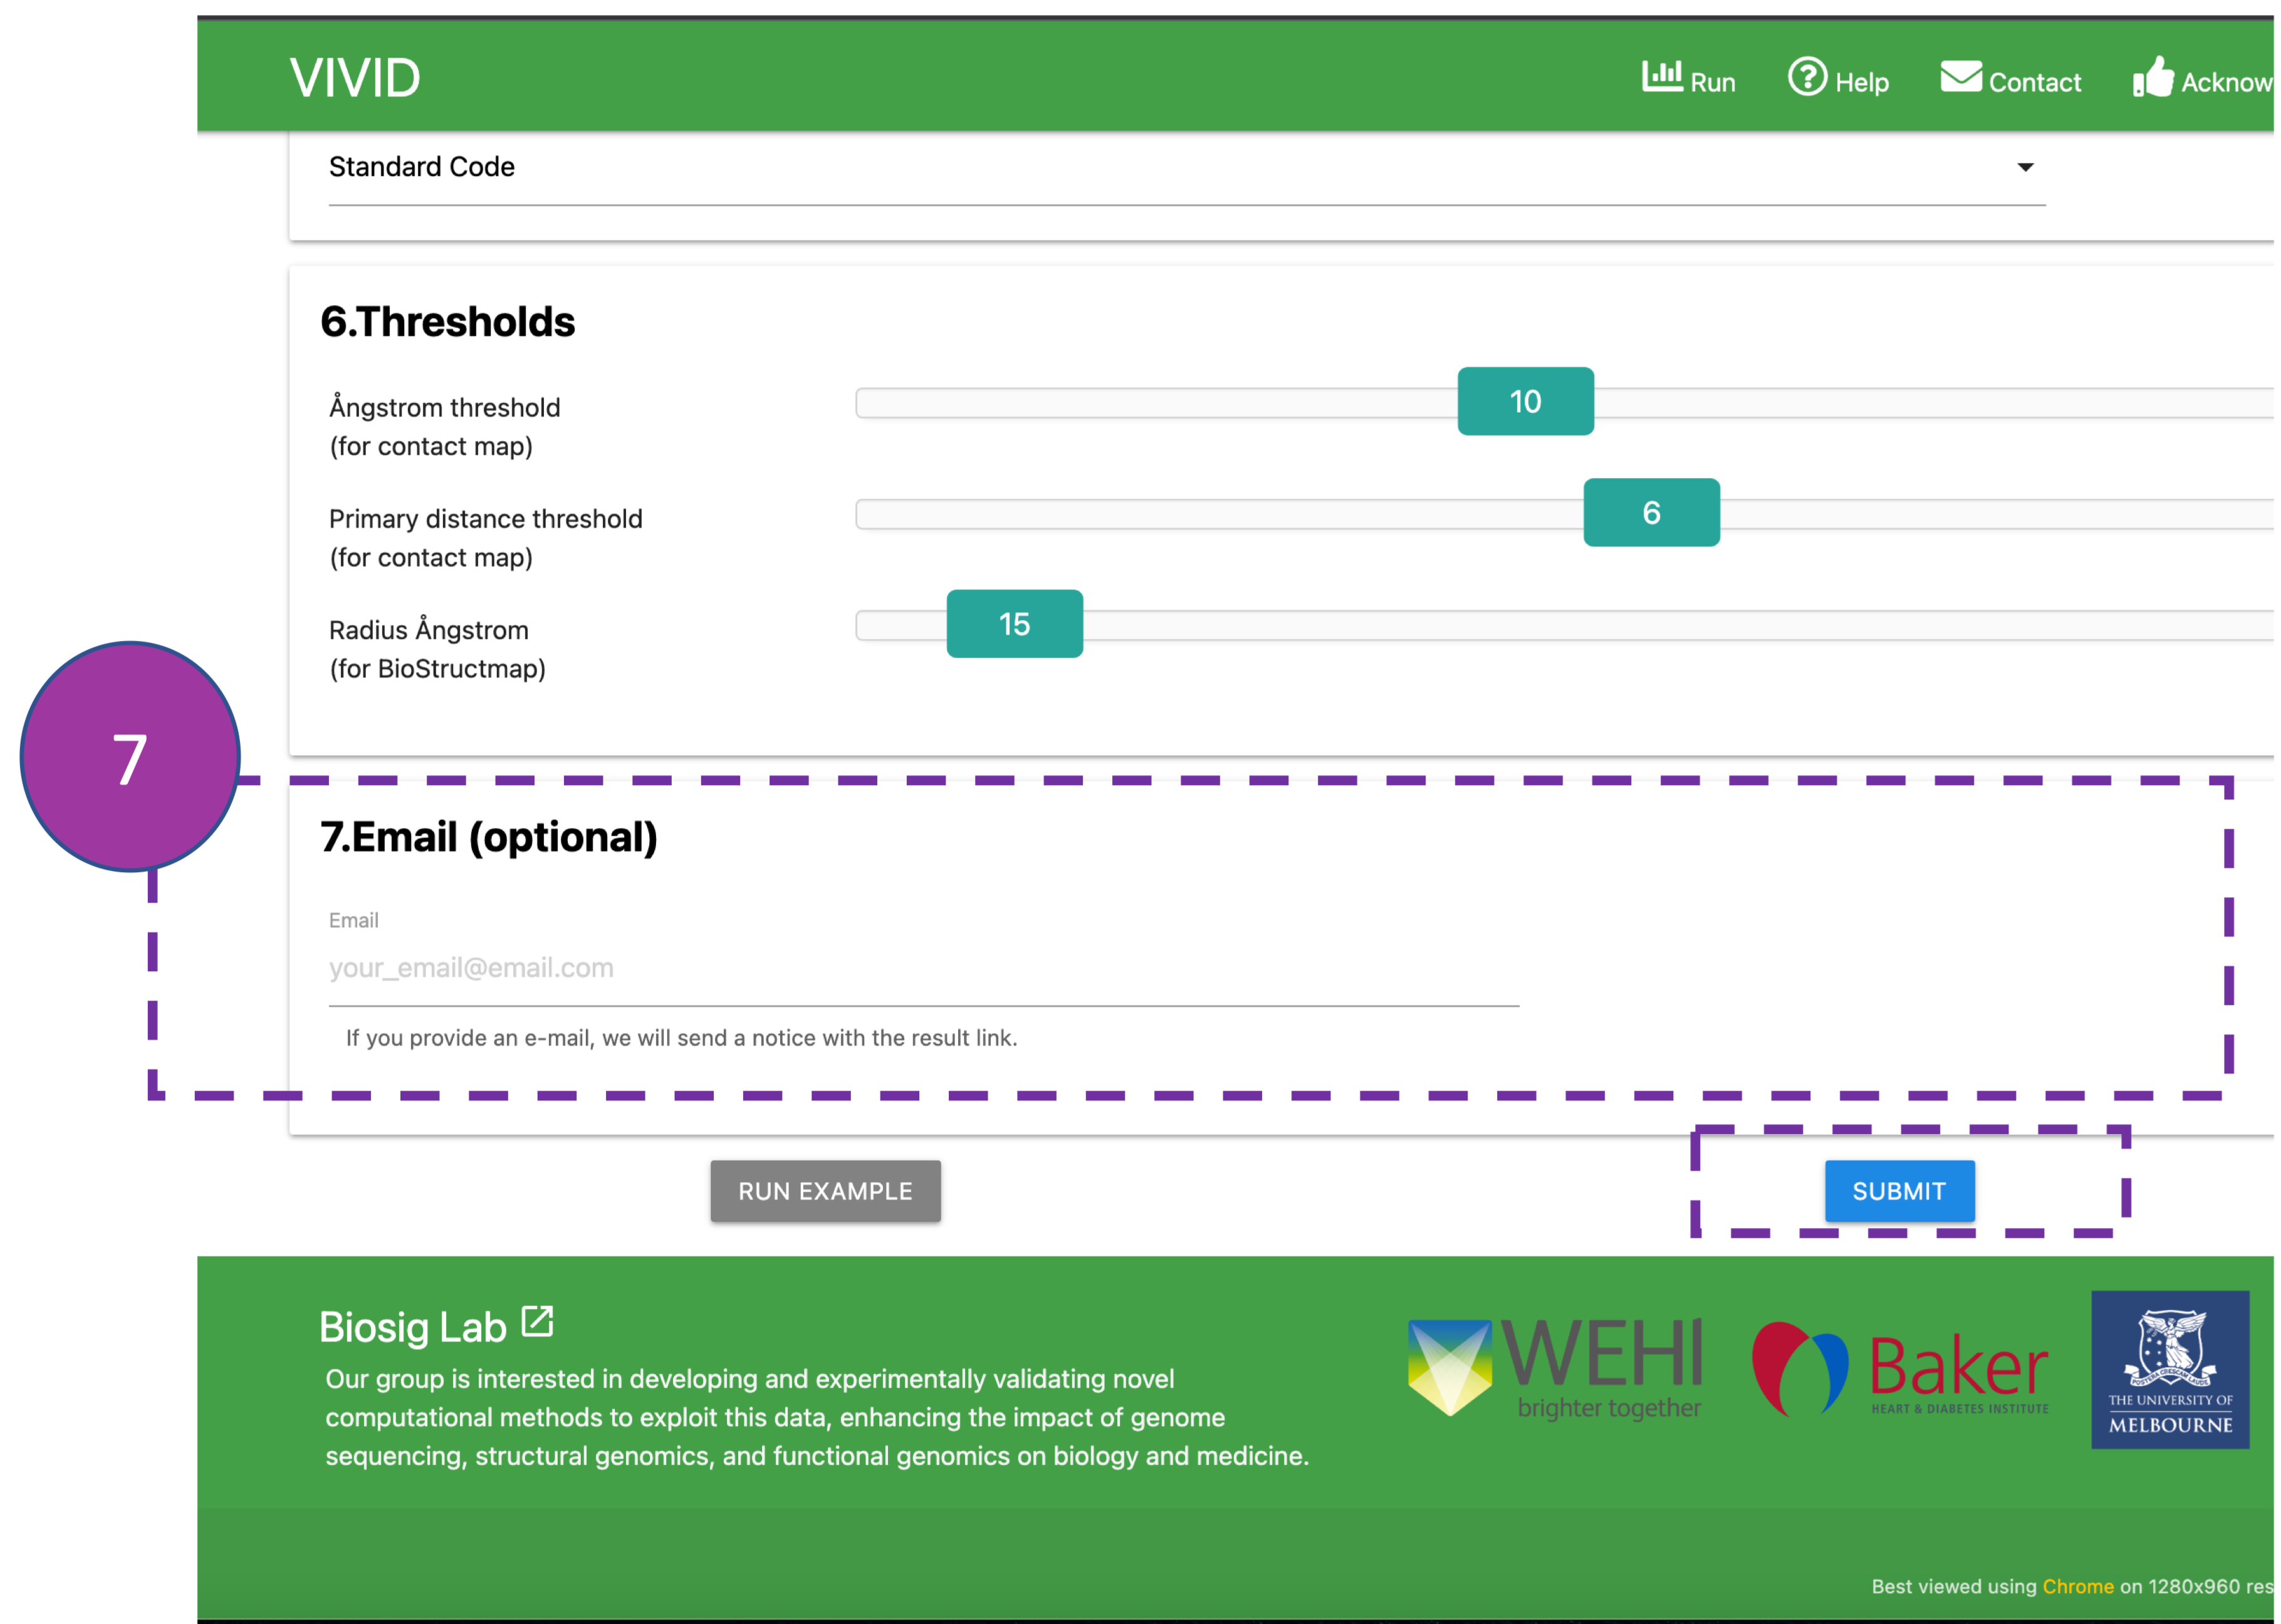
Email
By providing an Email address, the user can receive a notification email after job
completion.
Click SUBMIT to get your results.
Results
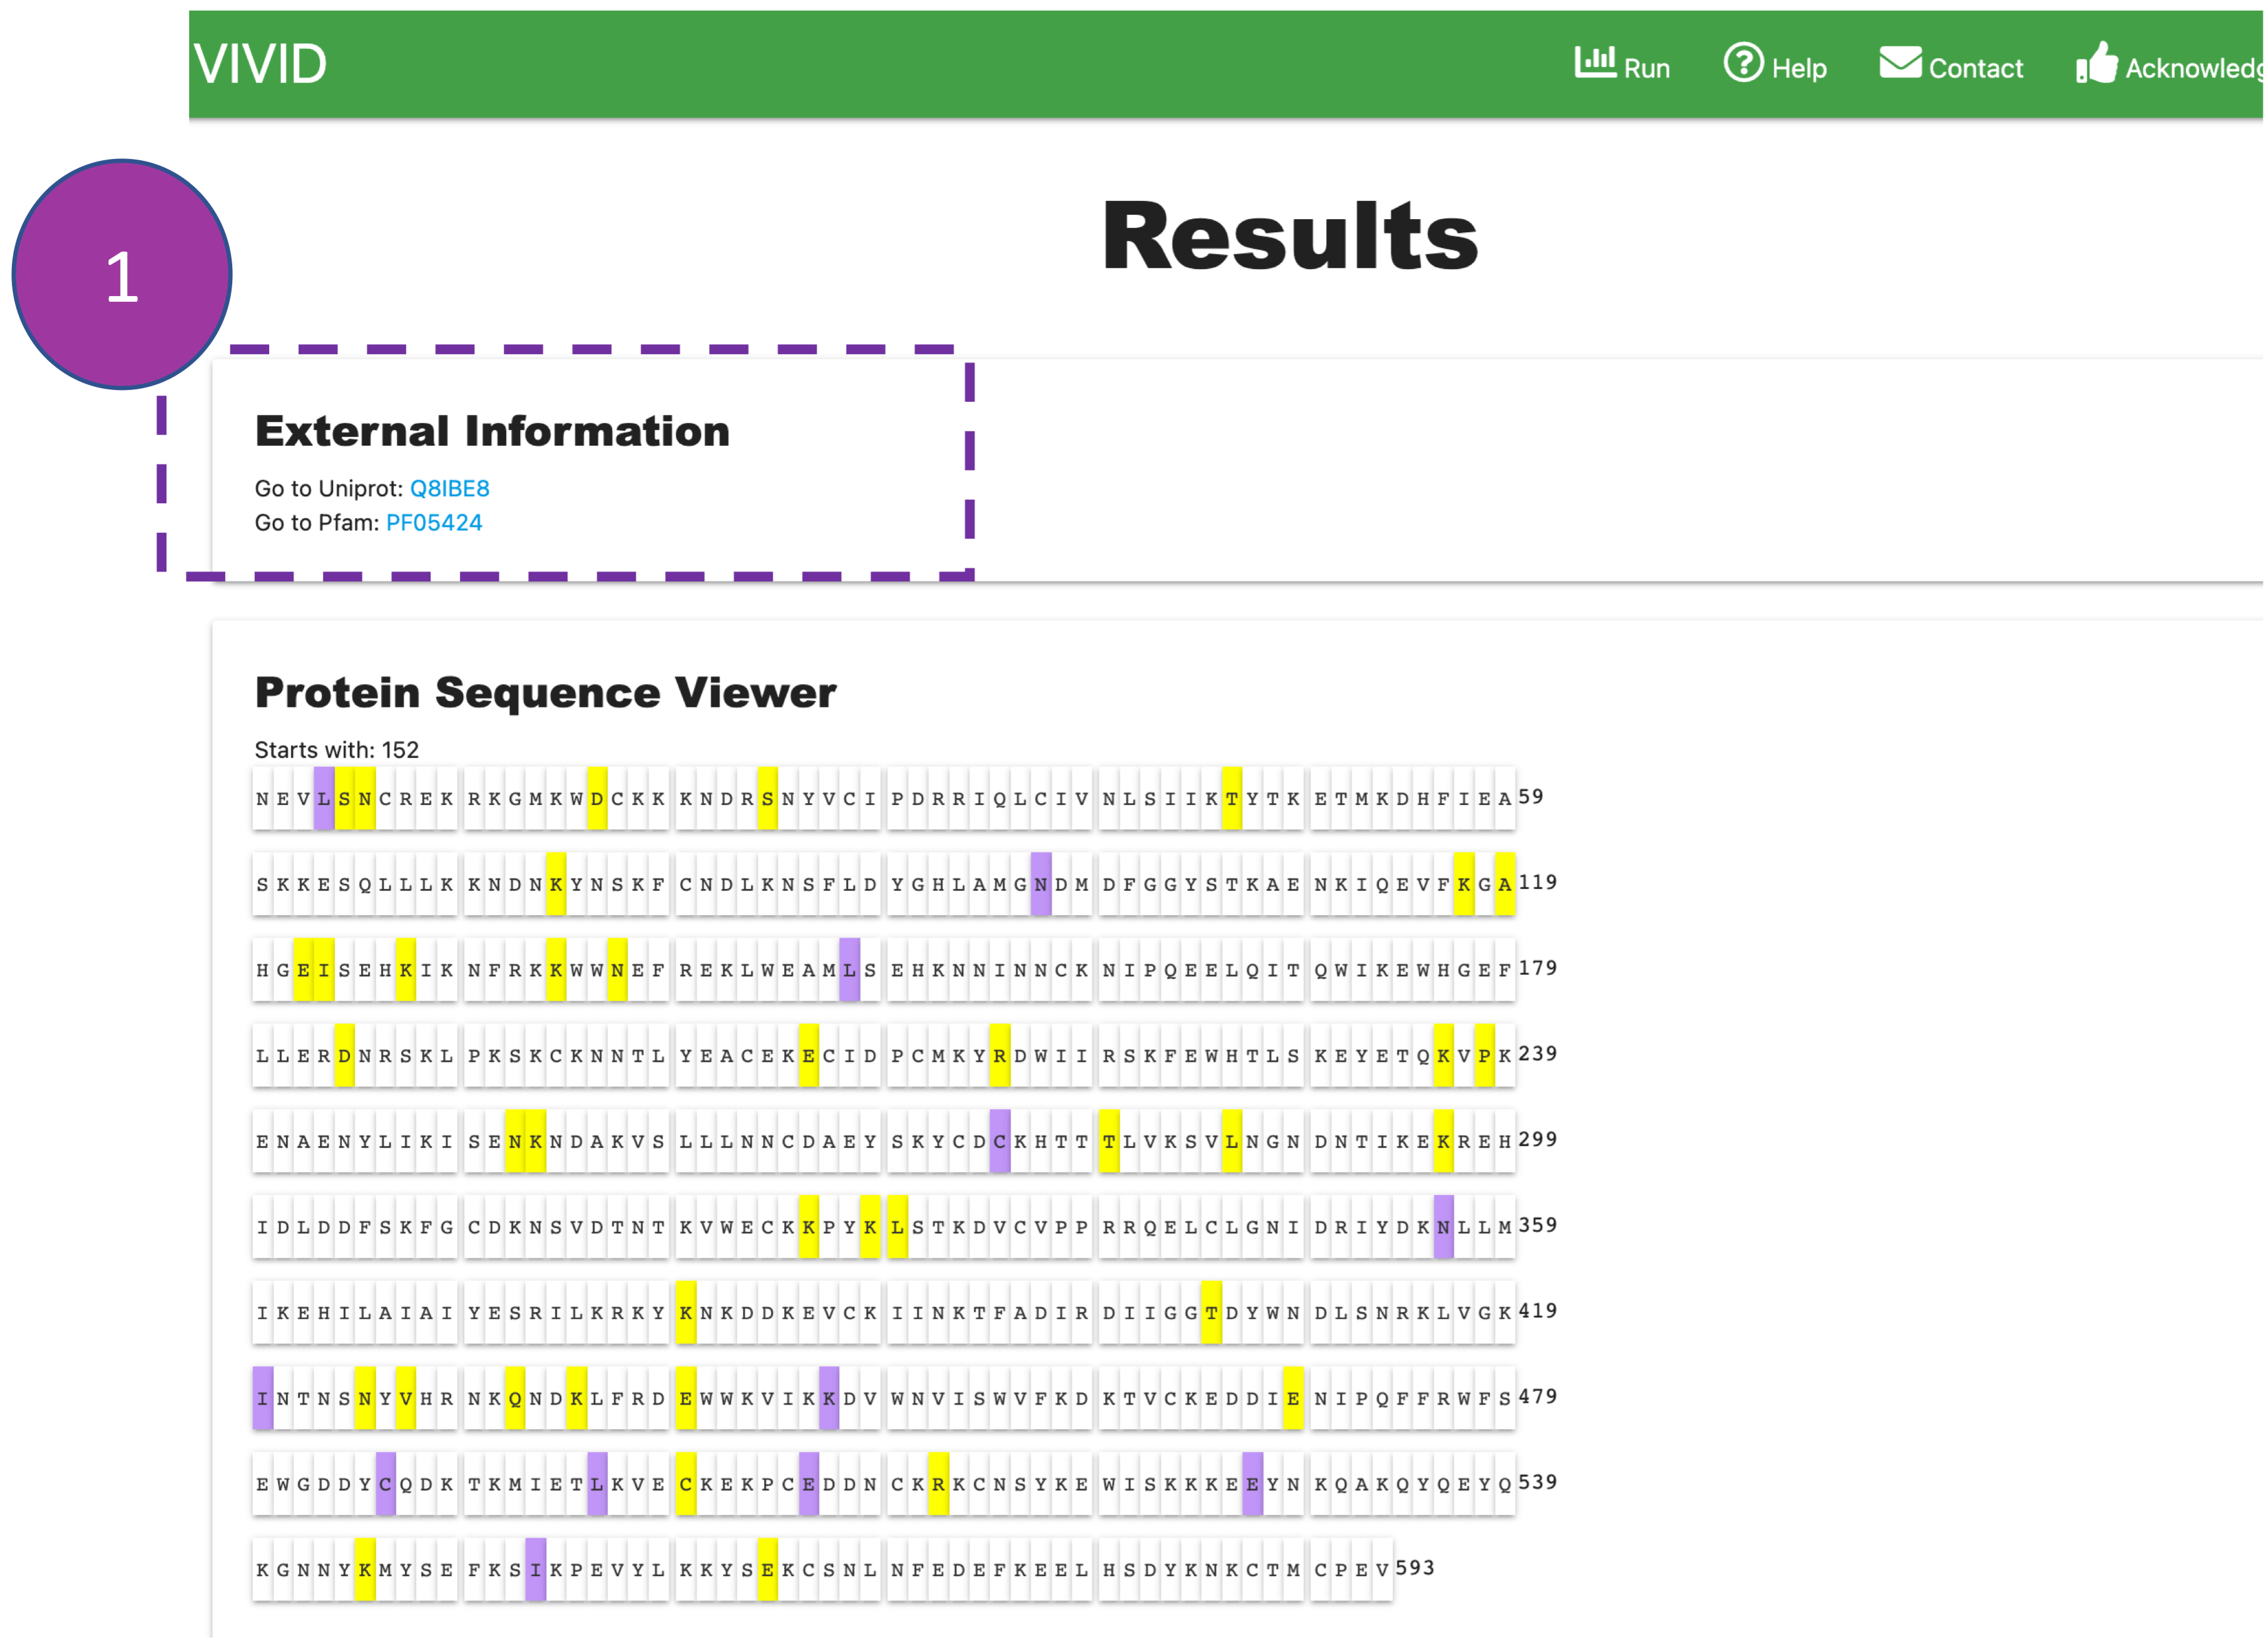
External Information
Provides a link for UniProt and Pfam databases to obtain additional biological information
where
users
can render structural and functional domain information
(e.g., conserved structural domains, active sites, etc.) on protein sequence and structure
to
identify
mutational hotspots.
Please note:
The UniProt and Pfam IDs are obtained by performing a BLAST search of the nucleotide query
sequence
against the SWISSPROT database.
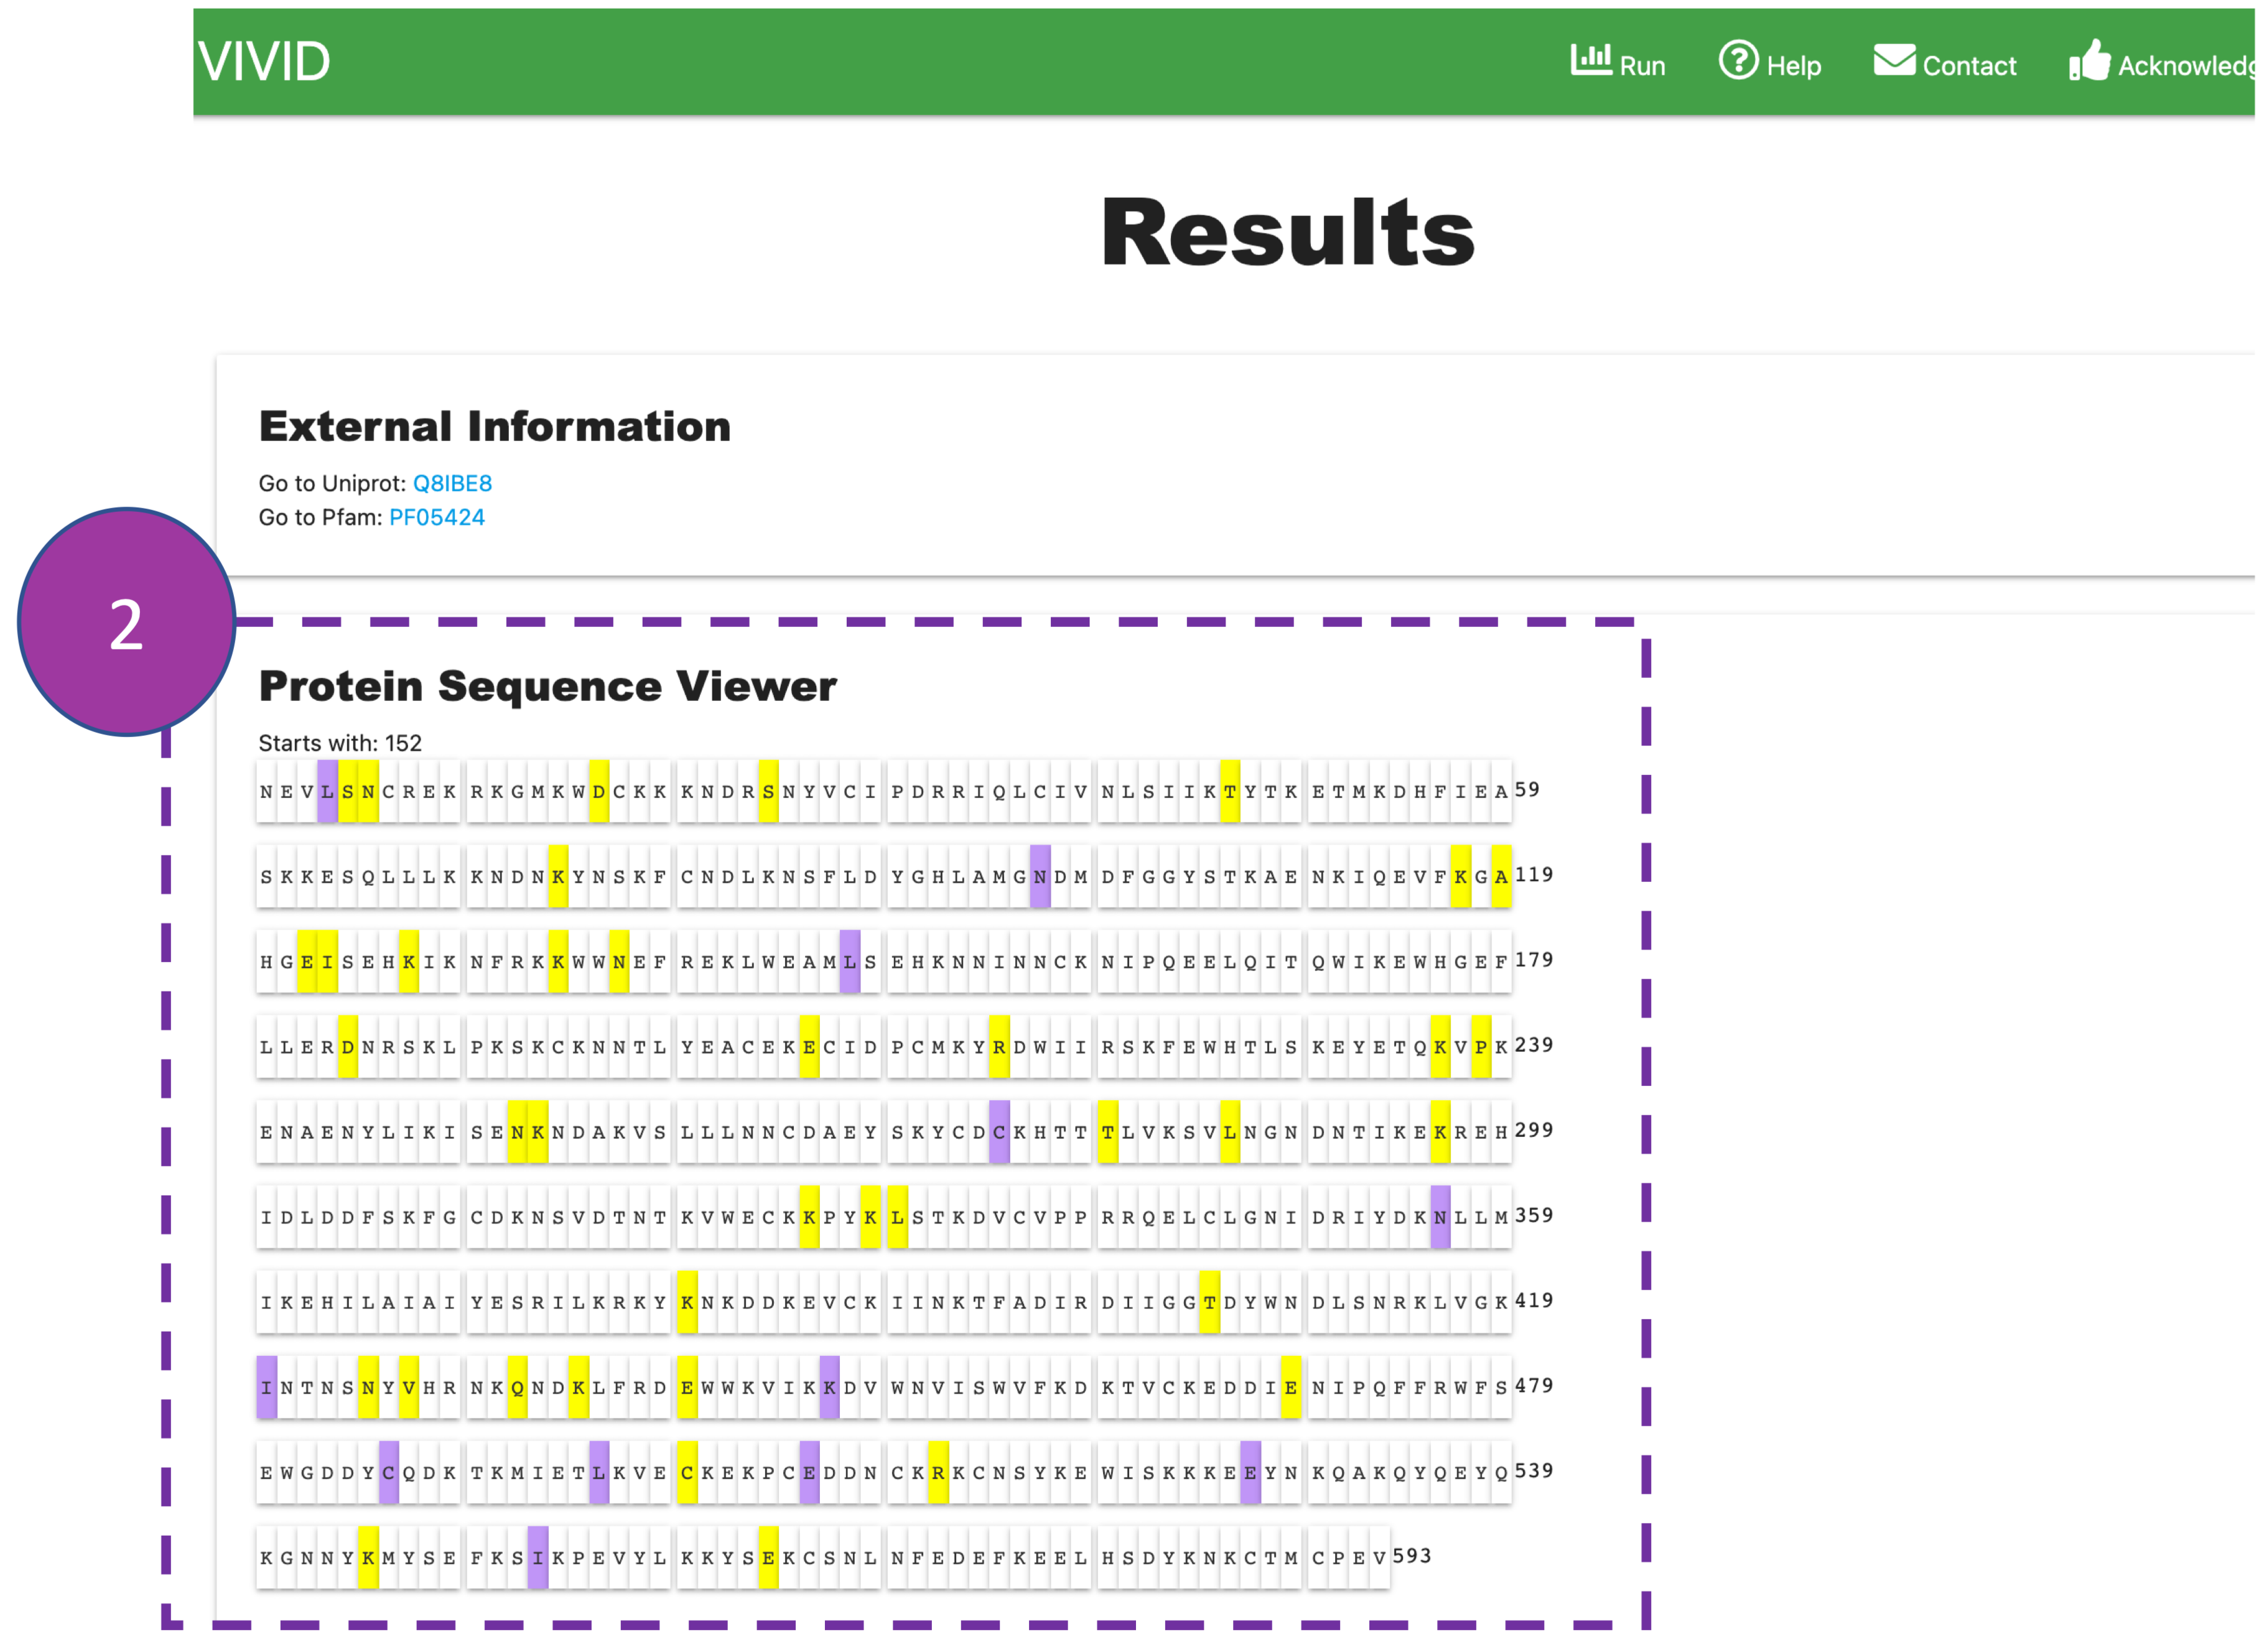
Protein Sequence Viewer
The nucleotide coding sequence of a gene is encoded into amino acid residues of a protein
where
synonymous (purple) and non-synonymous (yellow) mutations are highlighted
by default. Only residues present in the PDB file are represented in the primary sequence.
This
interactive panel can be used to select and highlight External Information
from above, in primary sequence and 3D visualisation.
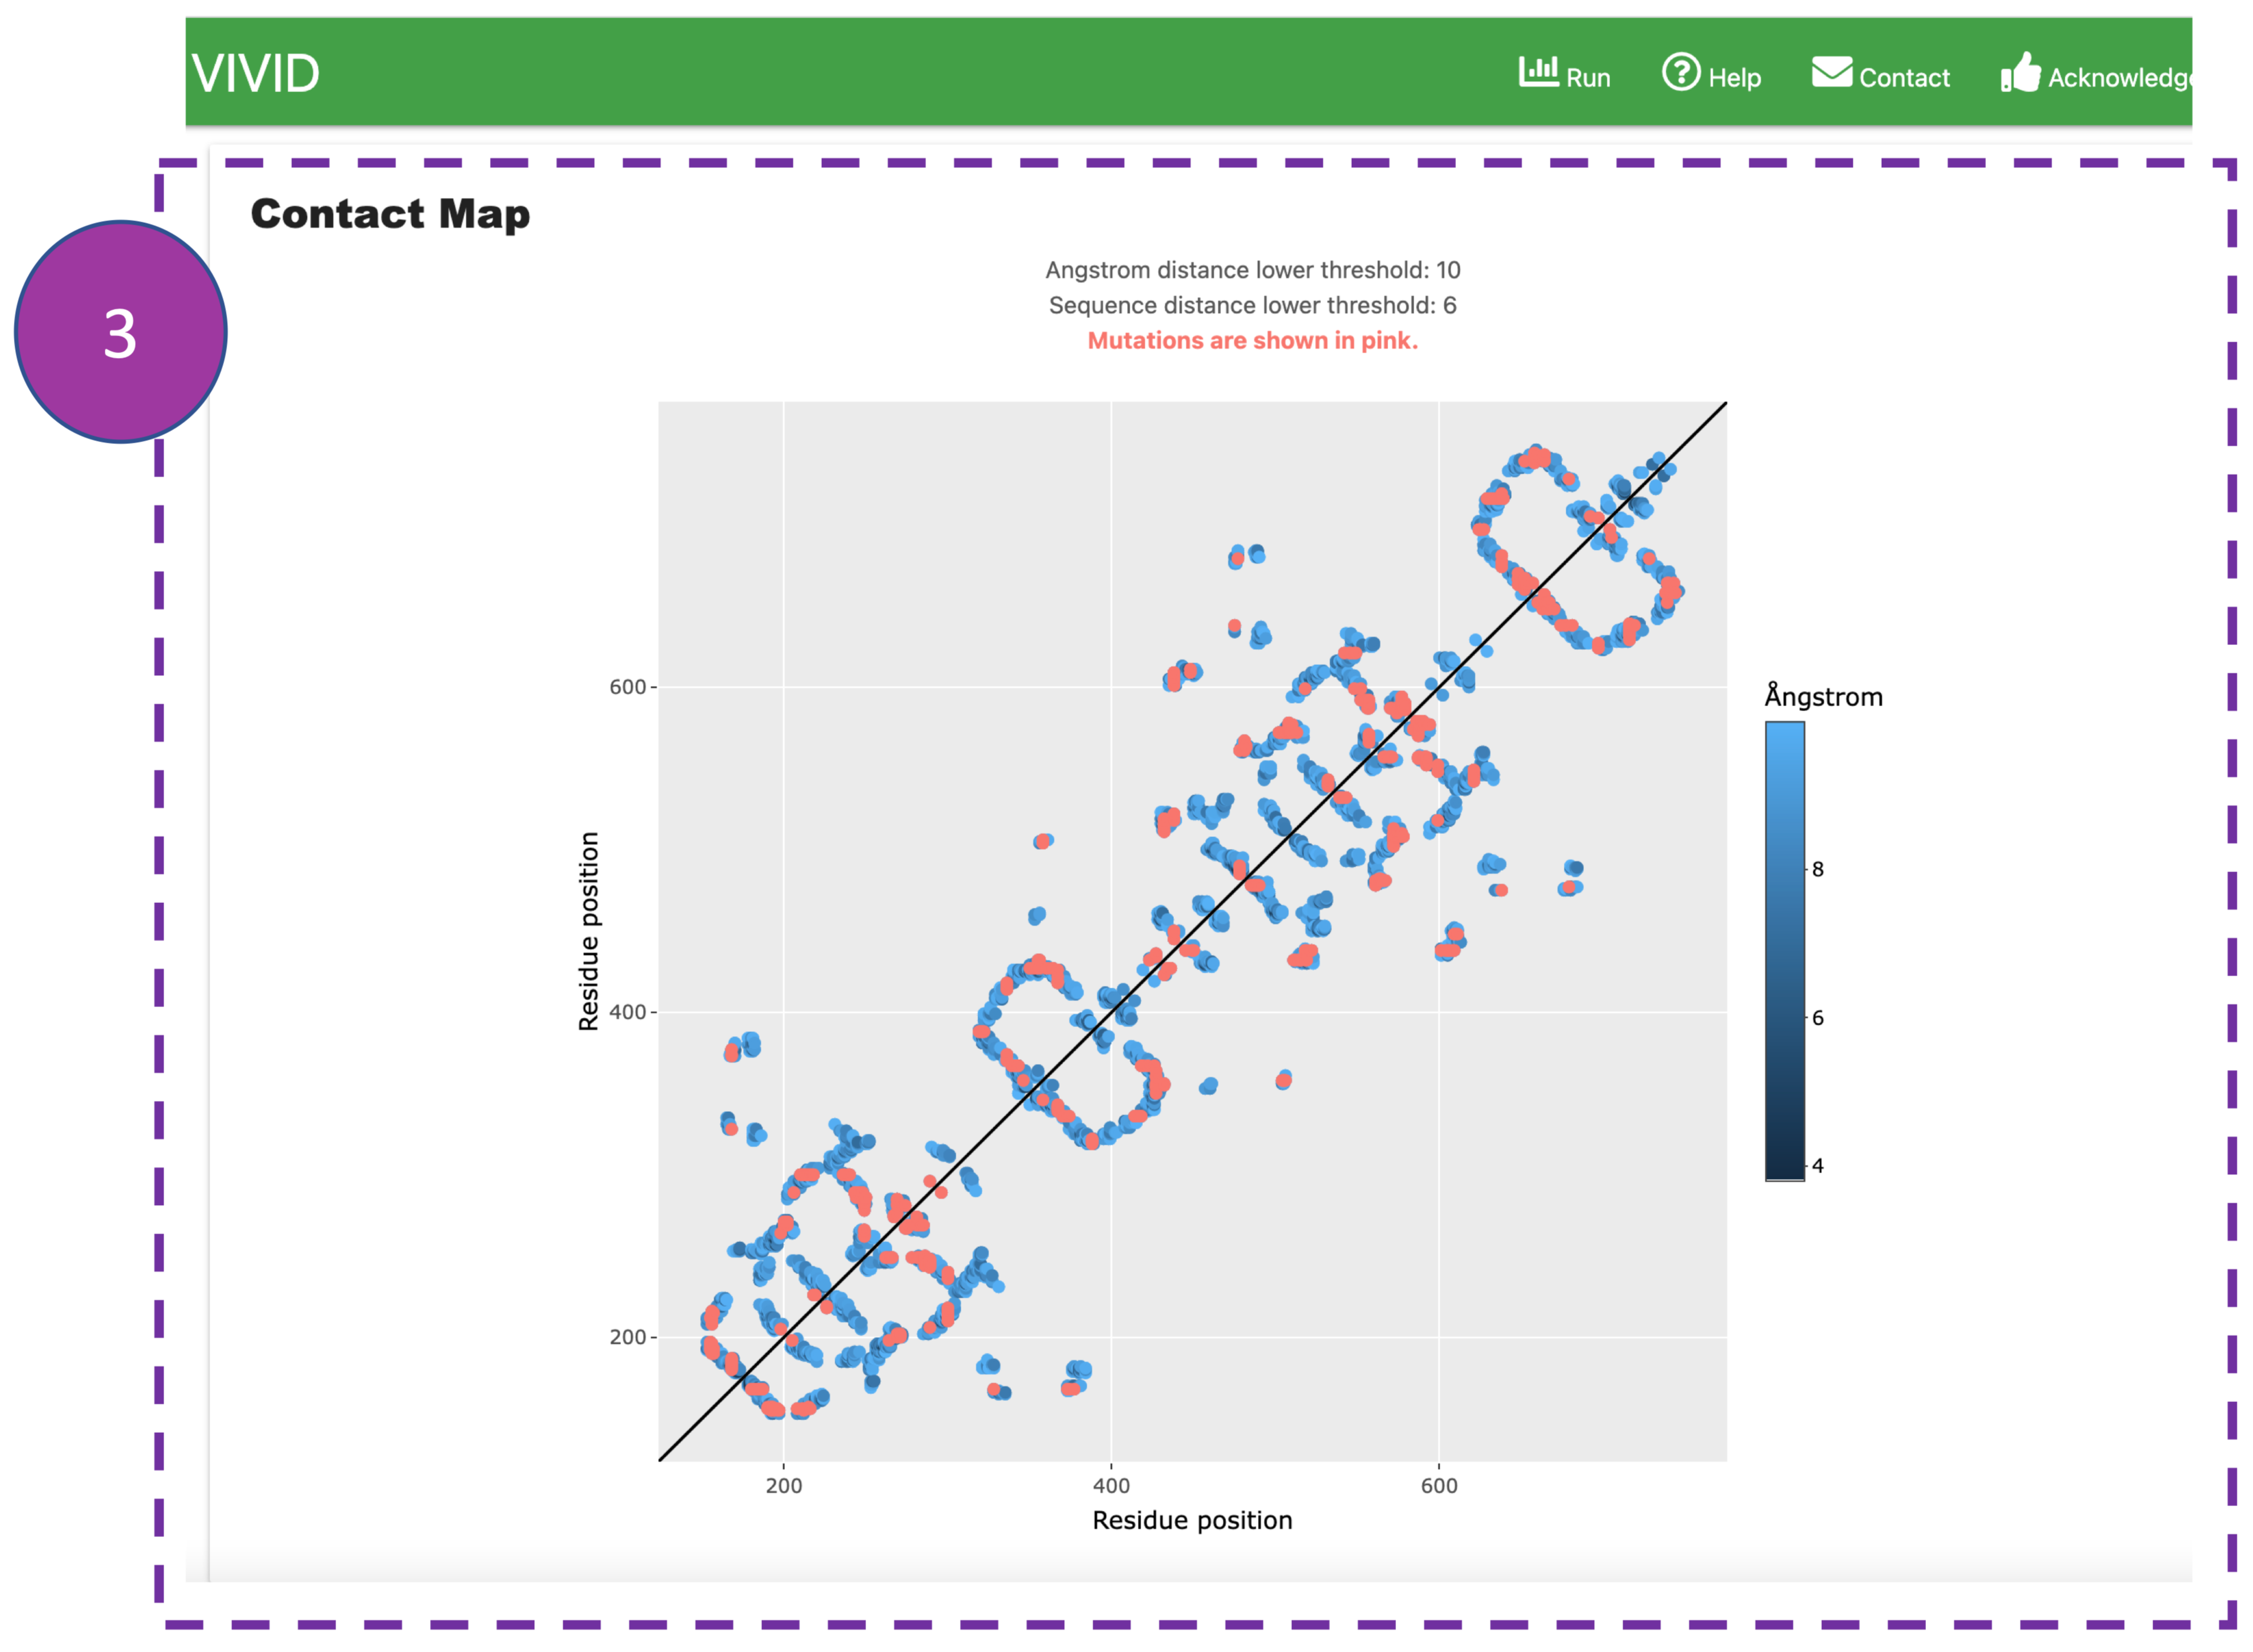
Contact Map
This represents pairwise residue-residue interactions. Interactions within user-defined
Ångular
threshold in 3D space and found more than the primary distance threshold
are shown in blue, where interactions involving mutated residues are highlighted in pink.
This
interactive panel allows users to zoom in/out by selecting a box. Also, users can
hover
over
interactions to display details of interacting residues.
Please note:
If users want to display more long-range interactions in 2D space and avoid closerly
associated
residues
in the primary sequence, they can go back to the submission page
and increase the Ångstrom threshold and Primary distance threshold.
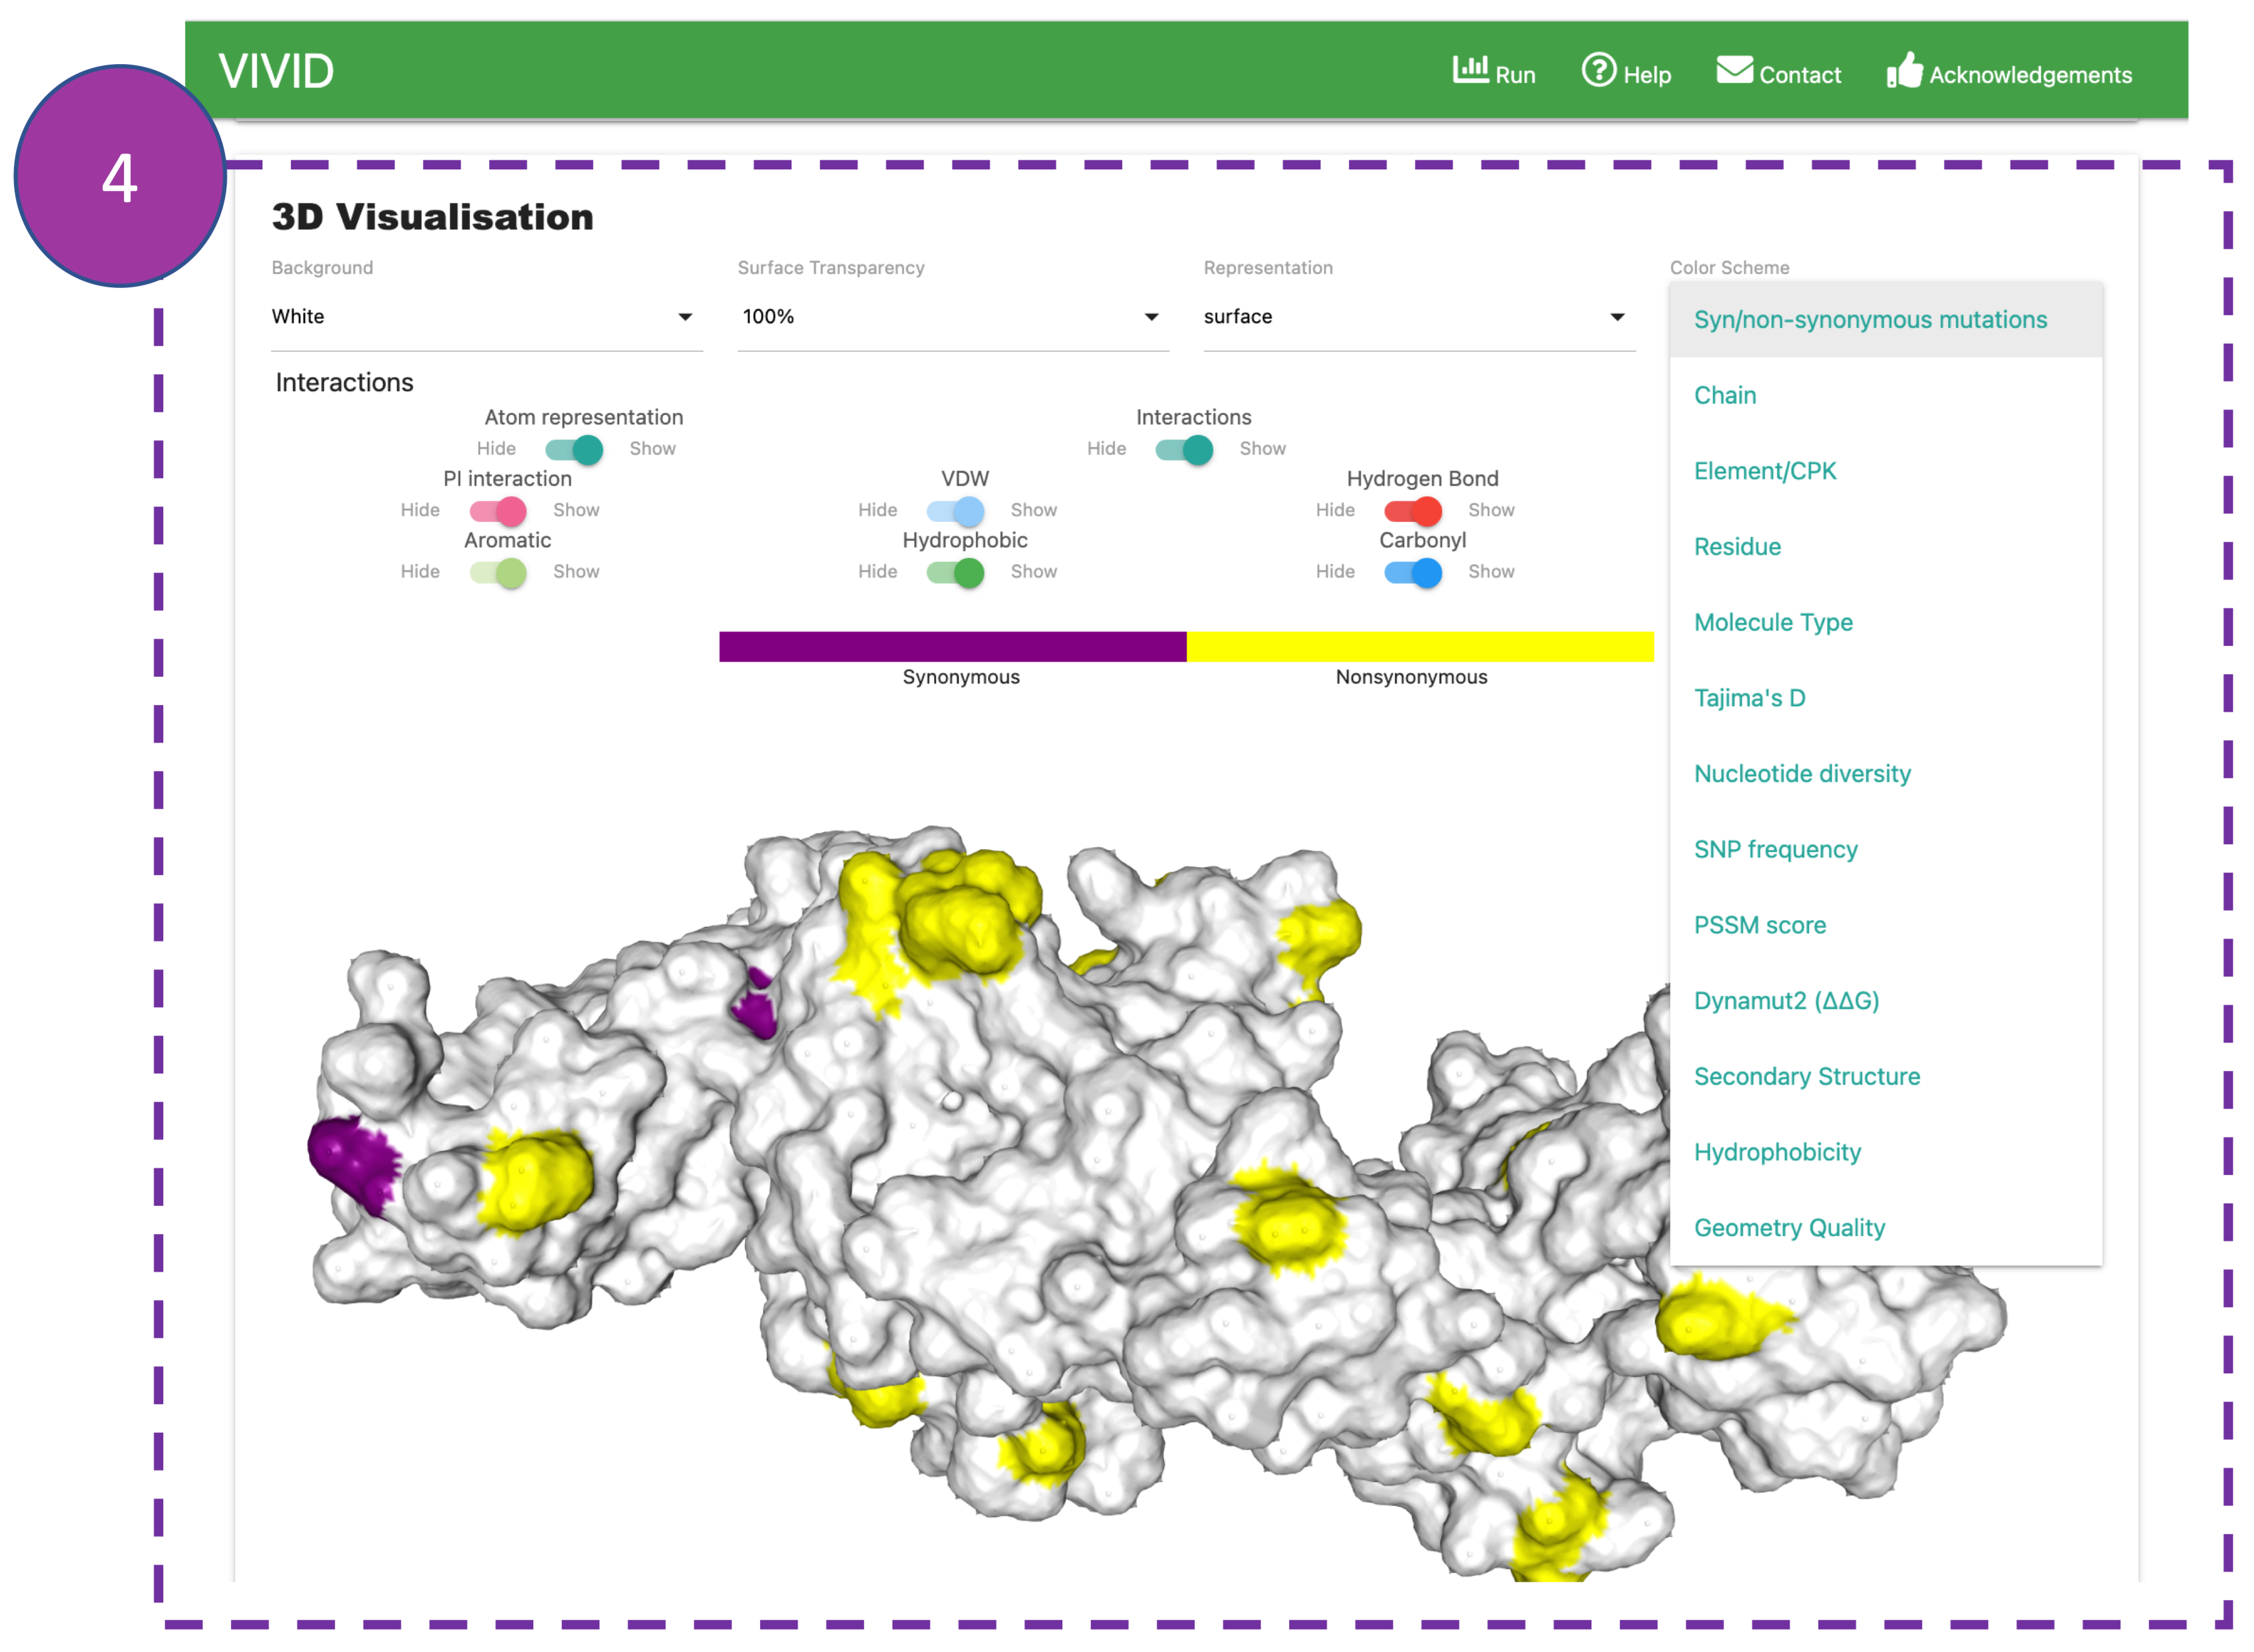
3D Visualisation
This panel shows interactive 3D viewer. Default view displays interatomic interactions
between
the
wild-type residue and nearby residues.
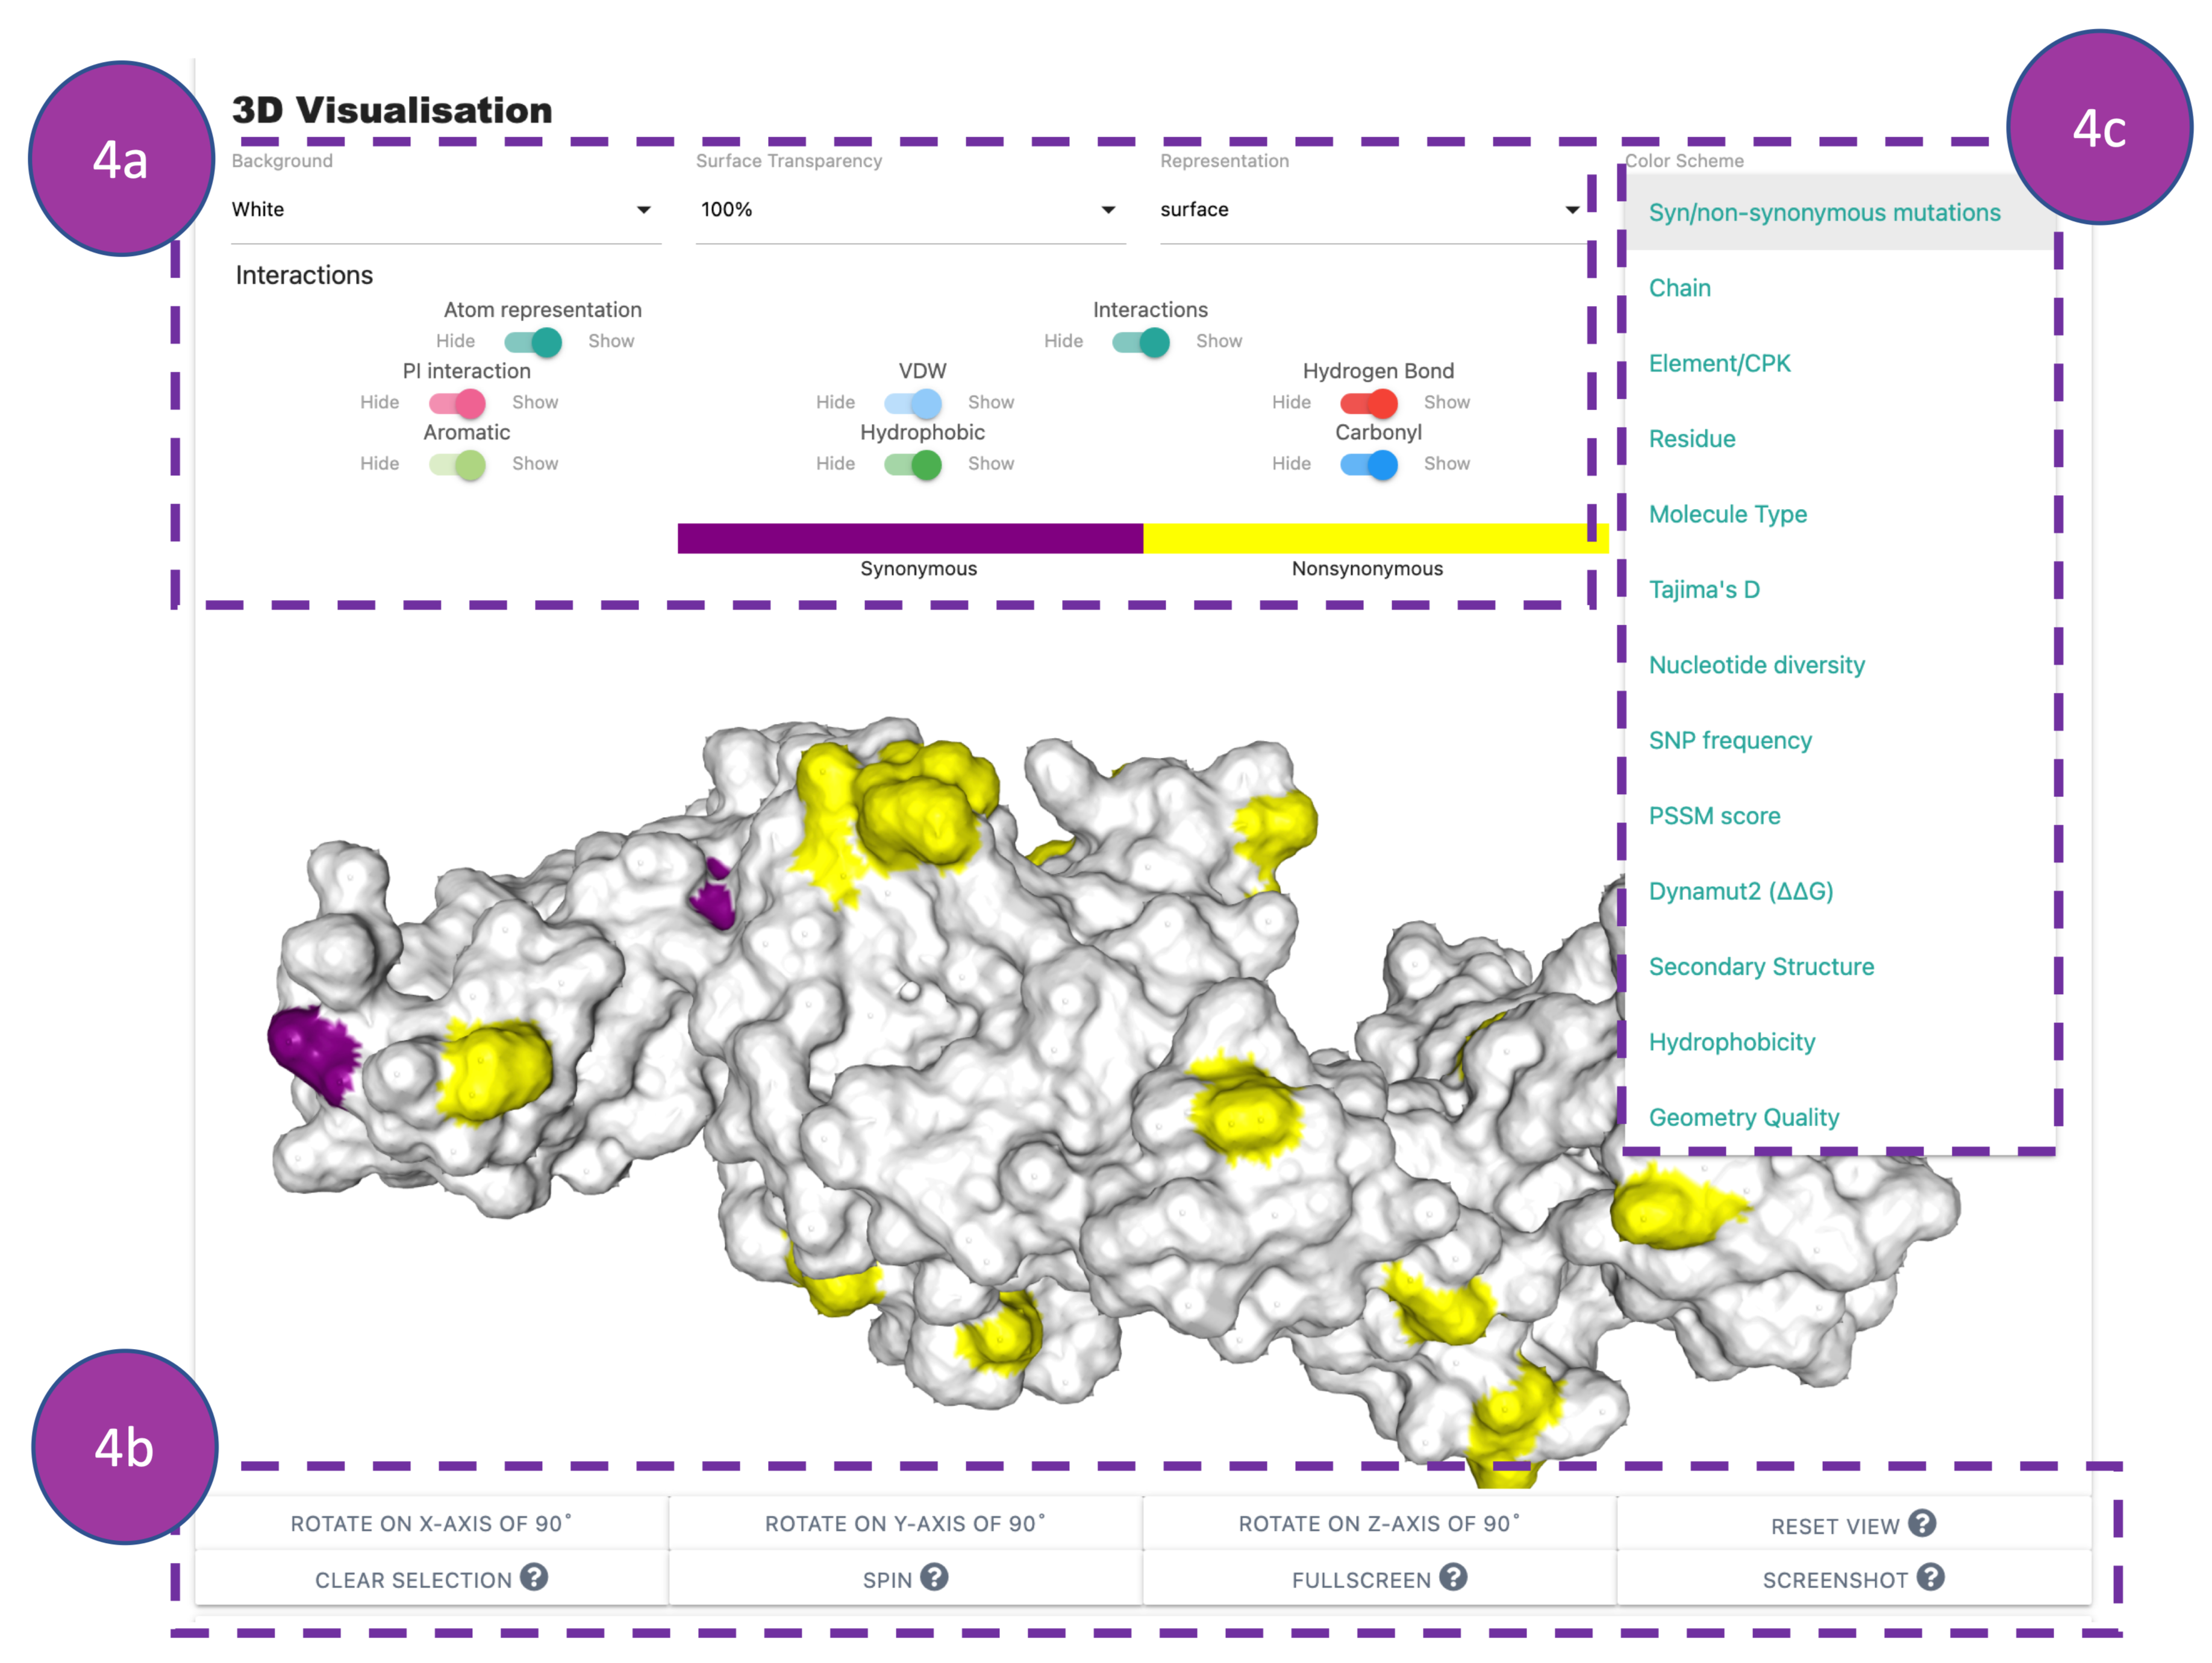
3D Visualisation
Interactions can be hidden or displayed using the controls provided (4a). The viewer
can
be
manipulated using buttons at the bottom of the panel (4b).
VIVID allows users to perform multiple 3D renderings using the control panel by selecting
options from
the 'colour scheme' drop-down menu (4c).
The default colour scheme is synonymous and non-synonymous mutations. Some interesting,
informative
visualisation in the 'colour scheme' could be Tajima's D,
Nucleotide diversity, SNP frequency, PSSM score, and Dynamut2 (ΔΔG).
Please note:
Population genetics indicies such as Tajima's D and Nucleotide diversity are calculated with
a
3D
sliding window (default Radius Ångstrom = 15) analysis in the
BioStructmap program.
Depending on the size of the protein, the default value of Radius Ångstrom might not be
sufficient;
hence the user can go back to the submission page and increase/decrease
the Radius Ångstrom threshold. For more details, please refer to the BioStructmap
publication.
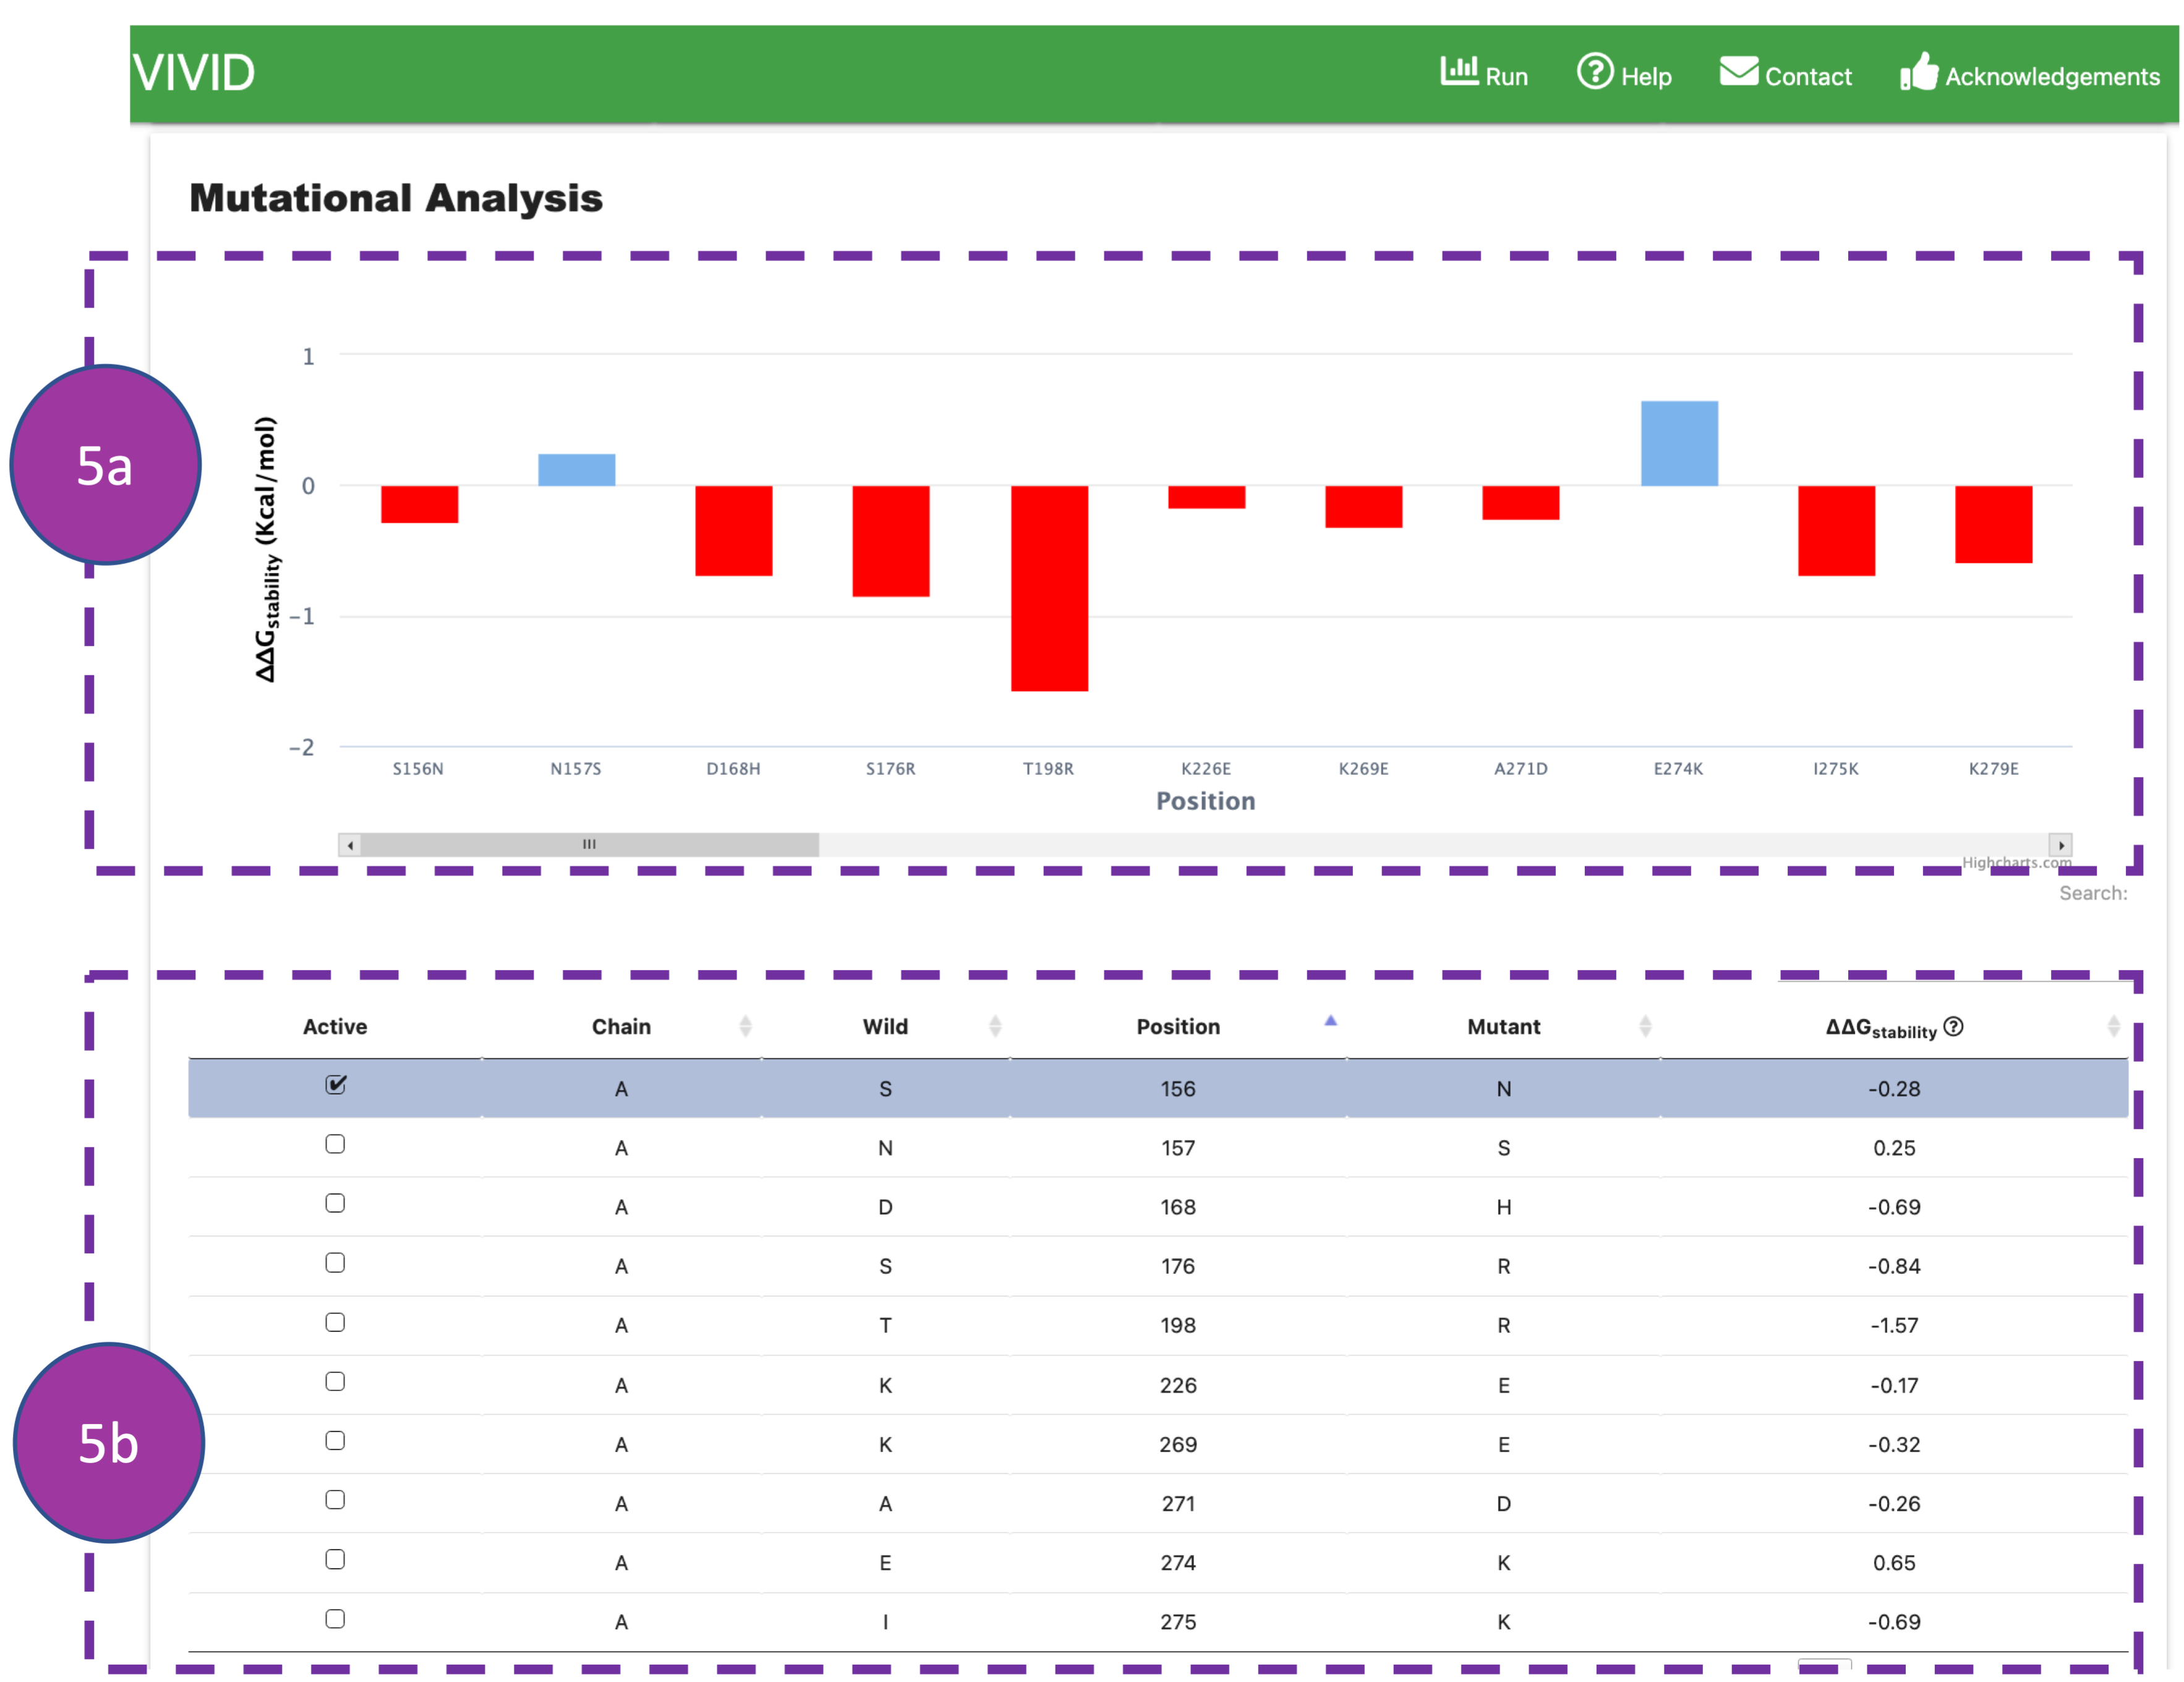
Mutational Analysis
This panel will be shown once Dynamut2 computations are completed. It displays predicted
changes
of
folding free energy (ΔΔG) of substituted amino acids on protein structure
stability and flexibility using the Dynamut2 program.
ΔΔG values are represented in a bar chart (5a) and tabular format (5b). ΔΔG
values
can
also be visualised in the 3D visualisation panel by clicking on a
drop-down menu of 'colour scheme'. For more details about ΔΔG calculation, please refer to
Dynamut2
publication.
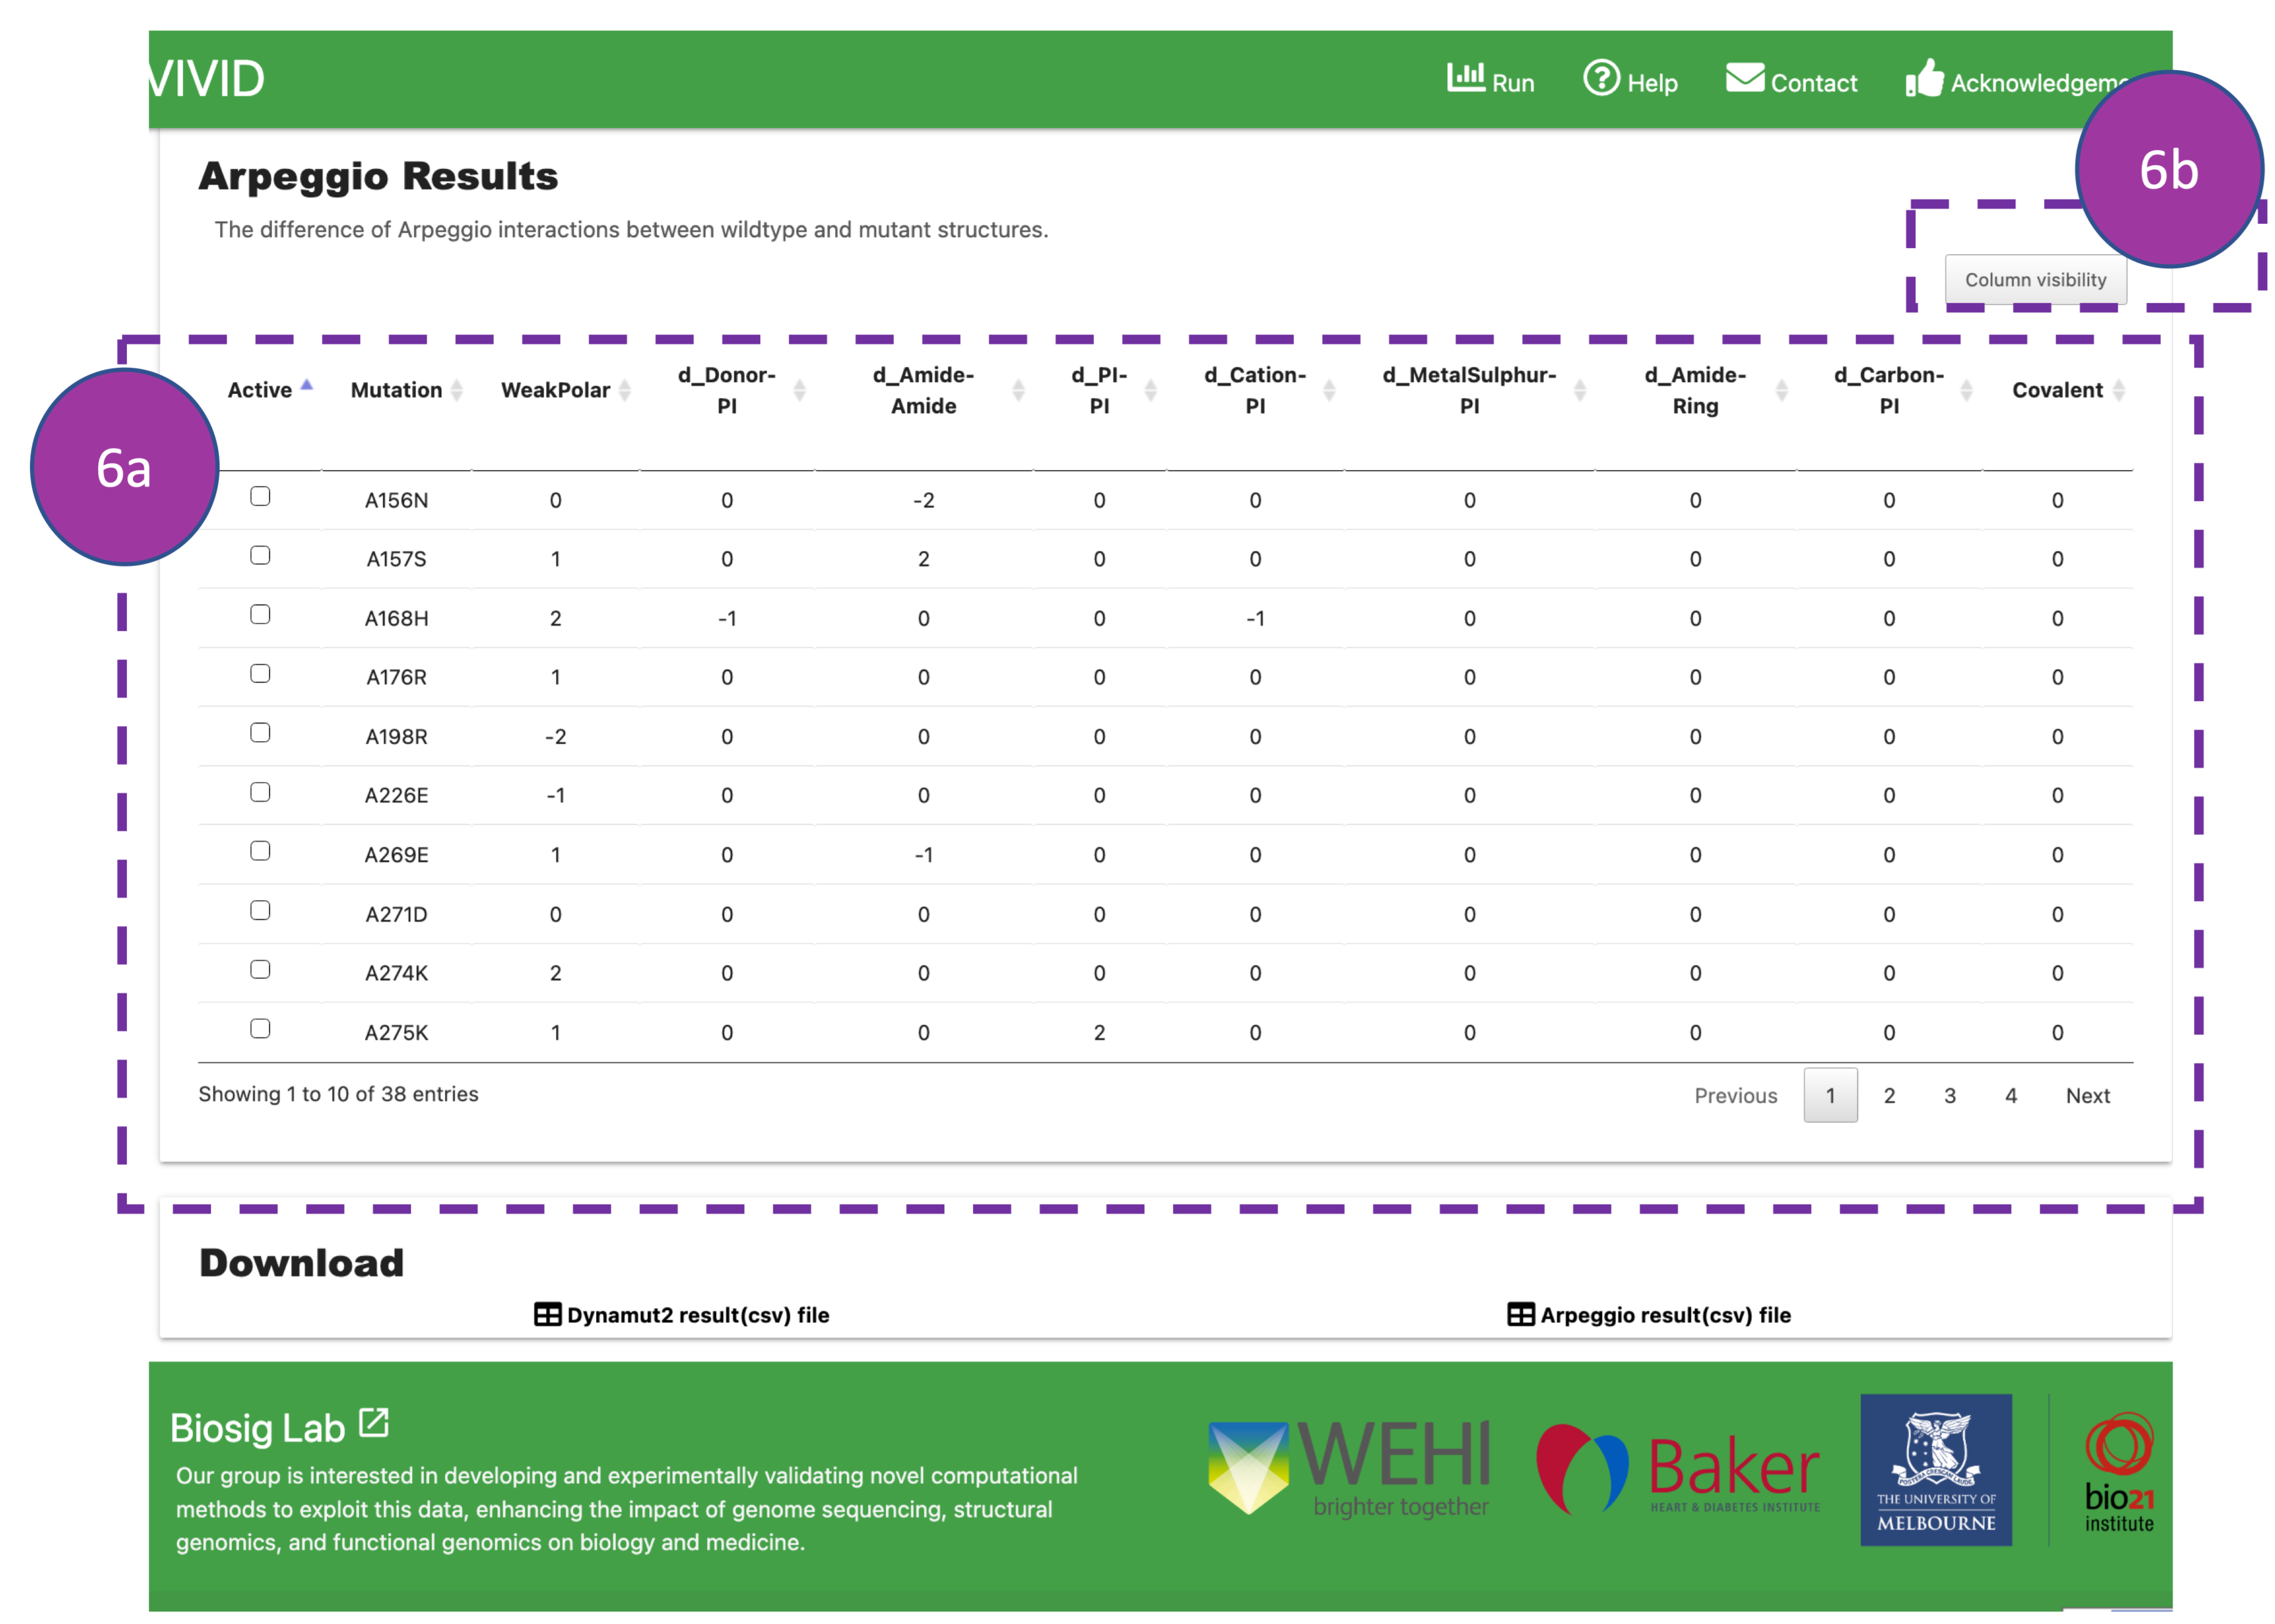
Arpeggio Results
This panel displays information about interatomic interactions between the substituted
residue
and
nearby residues in protein structures. Mainly, it reports changes among 20
interatomic interactions when compared wildtype and mutant residues. Users can use this
table to
get
information about lost and gained interaction after substitution in a
protein structure.
By default, information about nine types of interactions is shown in the table (6a).
Users can
click on 'column visibility' (6b) to display additional
interactions. For more details, please refer to Arpeggio
publication.
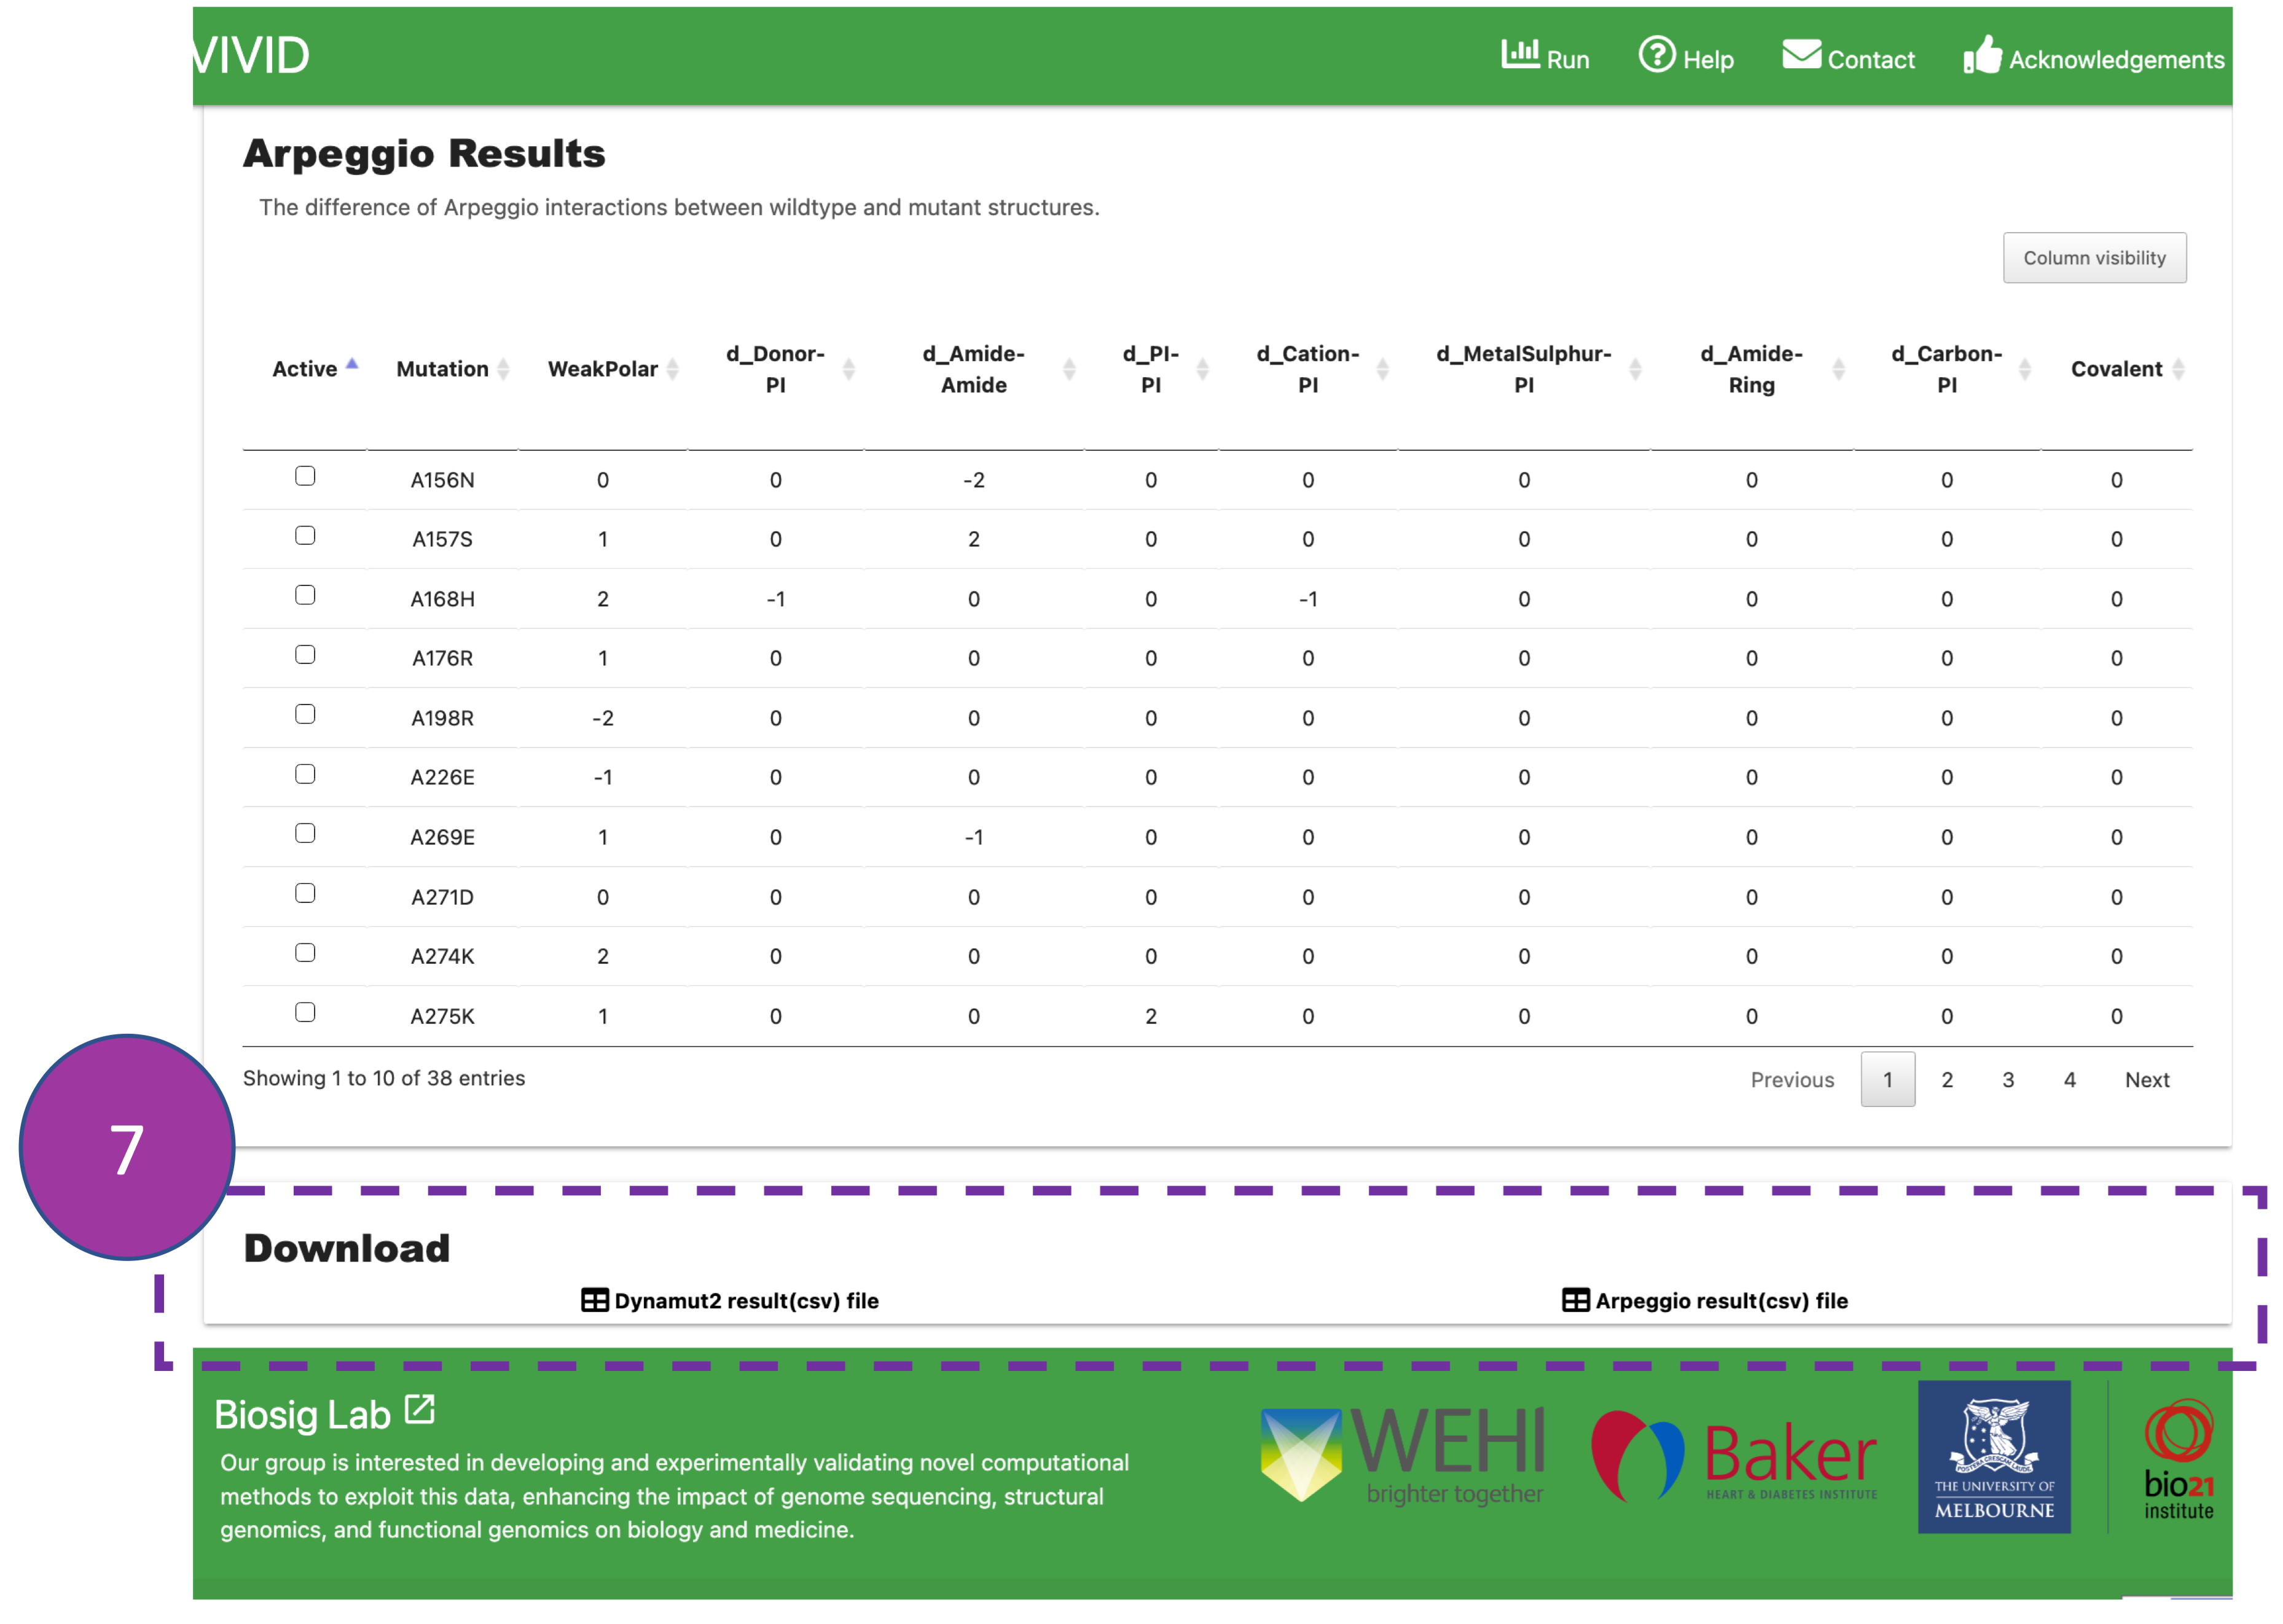
Download
Users can download results of Dynamut2 and Arpeggio interactions of substituted protein
residues.
Contact Us
In case you experience any issue with using VIVID or if you have any suggestions or
comments,
please do
not hesitate to contact us either via
email or our group
website.
If you are contacting regarding a job submission, please include details such as input
information and
the job identifier.