About
- Gene specific information for XRCC4 ,DNA-PKCS, KU and LIG4
- Lollipop plots of proteins
- Interactive 3D viewer of the protein structures
- Table of all the unique genomic variation for a given gene
- Plots for comparison of variant attributes
- Detailed Information about a particular variant
- Selection of a particular variant to display
- Interatomic interactions at residue level displayed as an Interactive 3D viewer
- Basic metadata for a single variant
- In silico predictions of the structural and functional consequences for a specific variant
- Variant attribute distribution plot, highlighting the individual calculated values associated with a given variant
- Software Dependencies
Gene specific details for XRCC4 ,DNA-PKCS, KU and LIG4
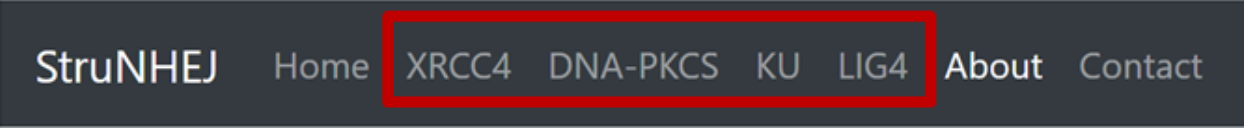
Information for individual genes can be found on the XRCC4 ,DNA-PKCS, KU and LIG4 pages.
These can be selected from the menu bar at the top of the screen, as highlighted in red below.
Each gene page contains 4 main sections:
- A lollipop plot showing protein-coding variants against the Pfam domains for the protein product of the gene.
- An interactive viewer of the protein 3D crystal structure.
- A table of all the unique genomic variants and the corresponding structural and functional consequences for this gene.
Lollipop plots of Proteins
A lollipop plot for LIG5 is displayed as an example below.
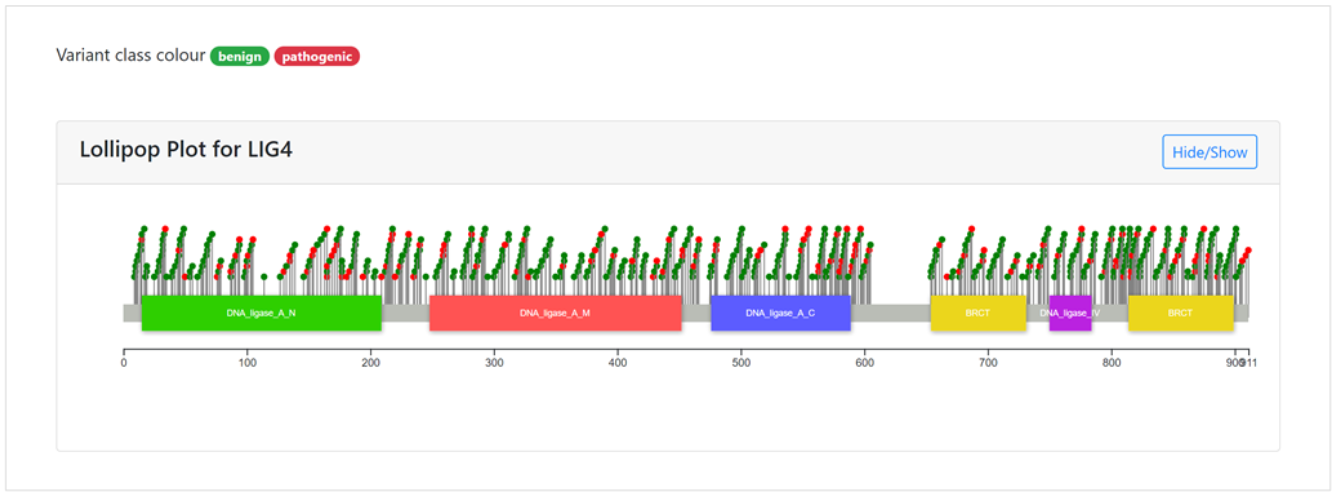
The main features of the plot are marked by A-E:
- Two classes of variants are shown in the plot,where pathogenic mutations are highlighted in red, and benign in green.These variants are classified according to their functional and structural impacts on the protein.
- The lollipop plot can be hidden or displayed using the Hide/Show button.
- Each variant is represented as a ball and stick at its protein coding position.
- Coordinates of amino acids in the protein sequence are displayed below the Pfam domains.
Interactive 3D viewer of the protein structures
An interactive 3D viewer of the protein structure of Human DNA ligase IV-Artemis Complex,
bound to ADP based on PDB entry 3W1B.
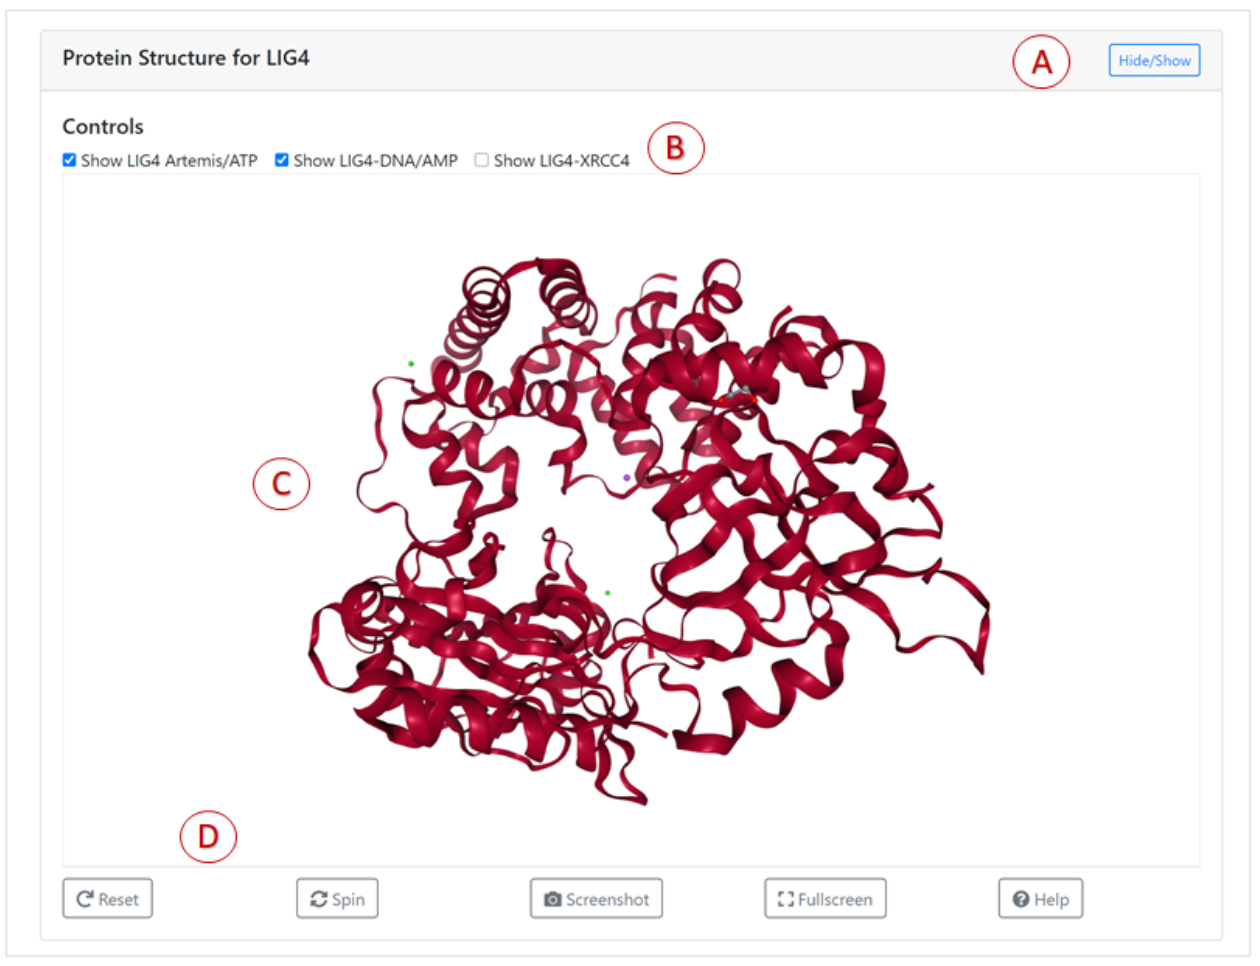
Main features of the 3D viewer are marked by letters A-D:
- The 3D visualisation can be shown or hidden via the Hide/Show button.
- The LIG4-Artemis ,DNA and ATP can be displayed by the control check boxes.
- The 3D structure of the protein can be rotated, zoomed using mouse controls. Users can click on the Help button for more information about the controls.
- The buttons displayed at the bottom of the panel can be used to adjust the visualisation of 3D structure.
Table of all unique genomic variation for a given gene
A table contains all unique variants for a gene along
with their respective position details. Individual variants in the
table can be selected by clicking on their rows in the table.
Additional details of a specific mutation can be displayed
by clicking on the details link in the right column of each row.
This will redirect users to a new web page for the chosen variant.
The new web page contains different information obtained from the mCSM tool suite,
on the variant effect and its consequence on the protein structure and function.
In addition to the pathogenicity predictions from a variety of in silico tools.
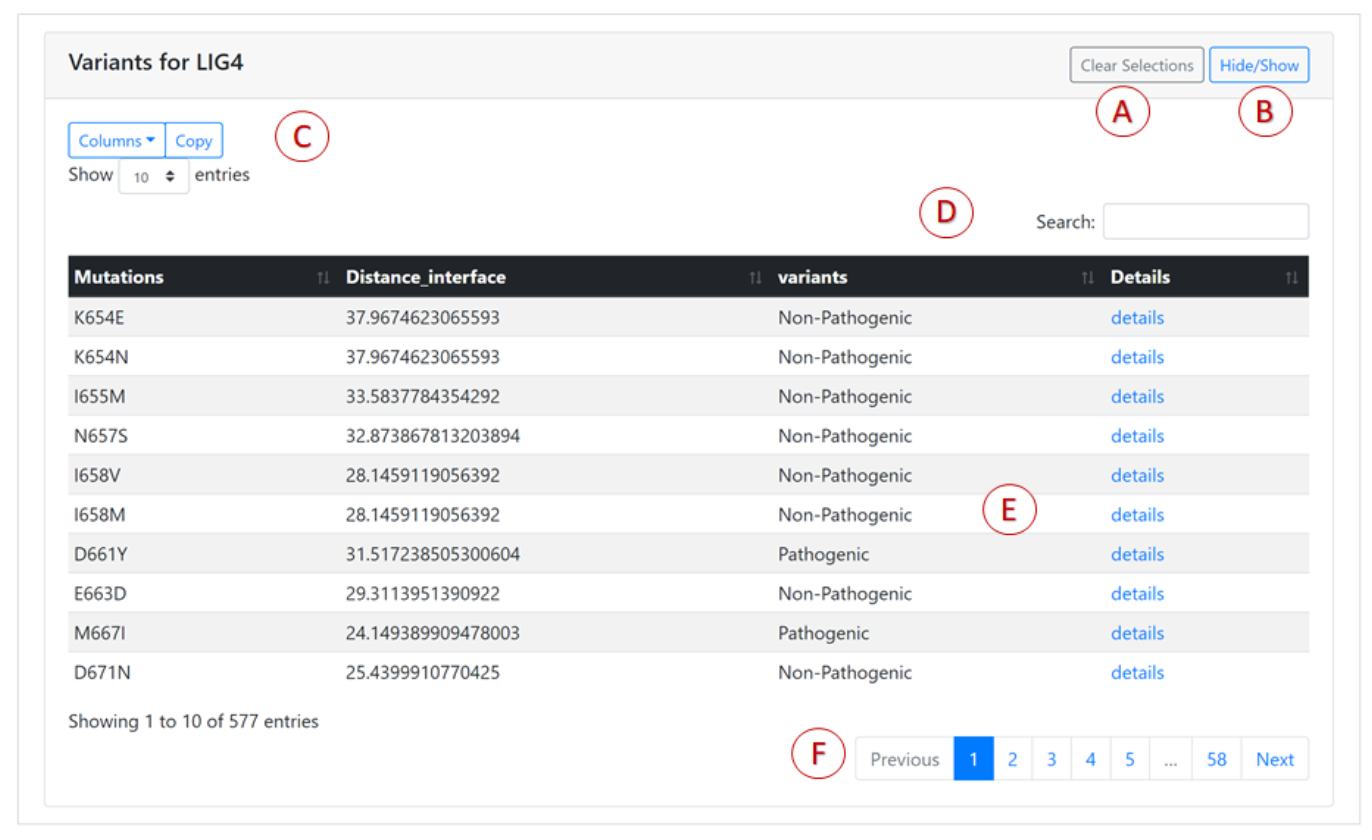
Main features of the mutations table are marked by letters A-F:
- All variants that were selected in the table can be de-selected via the "Clear Selections" button.
- The mutations table can be shown or hidden via the Hide/Show button.
- By default the variants table displays only specific key columns. This can be modified through the "Columns" button,which gives a drop-down list of the available columns. The contents of the mutations list can be copied to the clipboard using the "Copy" button. The number of rows shown in the table can be modified using the "Show entries" button.
- The "Search" box displays any rows that match the search term.
- Certain details for a specific mutation can be viewed using the "details" link. This will redirect users to a new web page for the selected variant.
- The buttons at the bottom of the table enable you to navigate through the pages.
Plots for comparison of variant attributes
Interactive 2D plots allow you compare any two attributes of
variants for a given gene. The attributes correspond to the
columns in the variant table above the plots.
Depending on the types of variables selected different types of plots will be given:
- Stacked bar plot: when both axes are categorical attributes.
- Stacked histogram: when the X axis is a continuous numerical attribute and the Y axis is a categorical attribute.
- Scatter plot: when both axes are continuous numerical attributes.
- Box plot: when the X axis is a categorical attribute and the Y axis is a continuous numerical attribute.
Numerical axes are plotted in log scale.
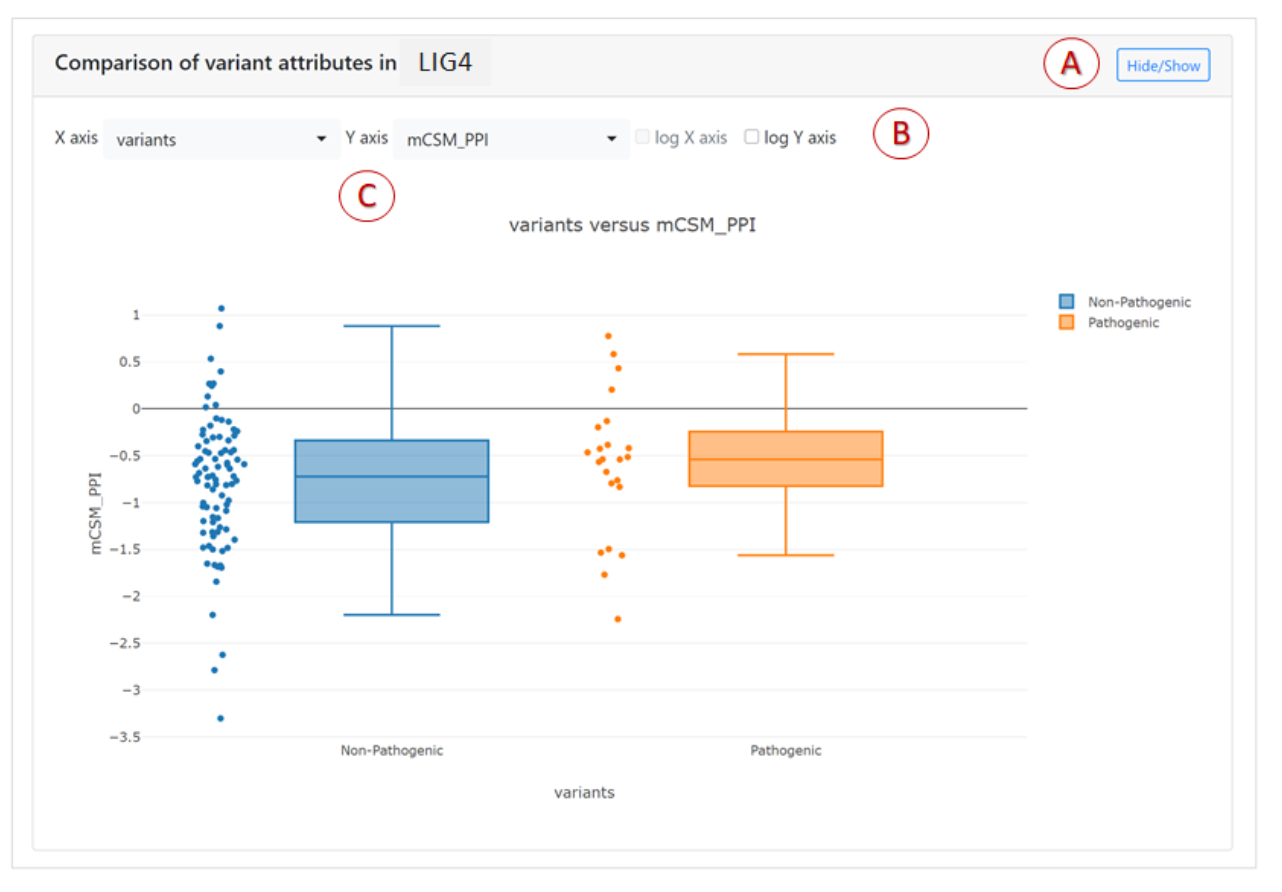
Main features of the plot are marked by letters A-C:
- The comparison plot can be hidden or shown via the Hide/Show button.
- Log-scale axes projection can be toggled for numerical attributes.
- The variant features plotted on the X and Y axes can be chosen. These are the same features which are displayed in the columns of the mutations table.
Detailed Information about a particular variant
Selection of a particular variant to display
A single specific mutation can be chosen from the mutations table on the
"XRCC4", "DNA-PKCS",”KU’’, and "LIG4" pages, by clicking on the "details"
link on the right column of the row for that variant.

A new web page will be opened that shows information about this particular mutation .
Interatomic interactions at residue level displayed as an Interactive 3D viewer
An interactive 3D viewer of the atomic interactions at the variant residue
is displayed at the top of the variant page.
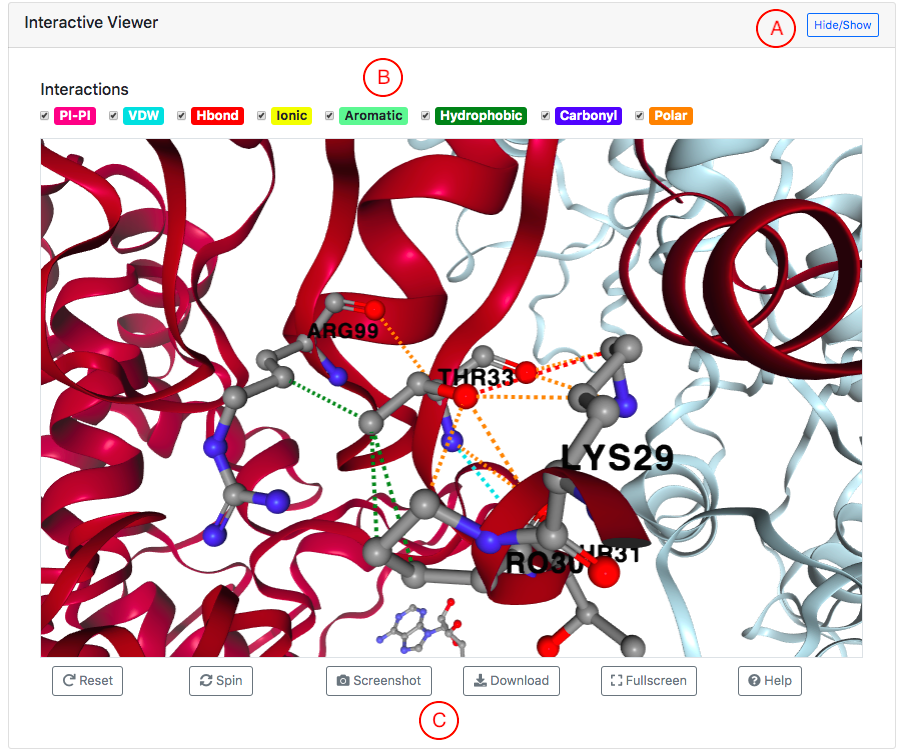
Main features of the 3D viewer are marked by letters A-C:
- The visualisation can be shown or hidden via the Hide/Show button.
- Different types of atomic interactions can be hidden or displayed using the controls provided.
- The 3D visualisation can be manipulated using buttons provided at the bottom.
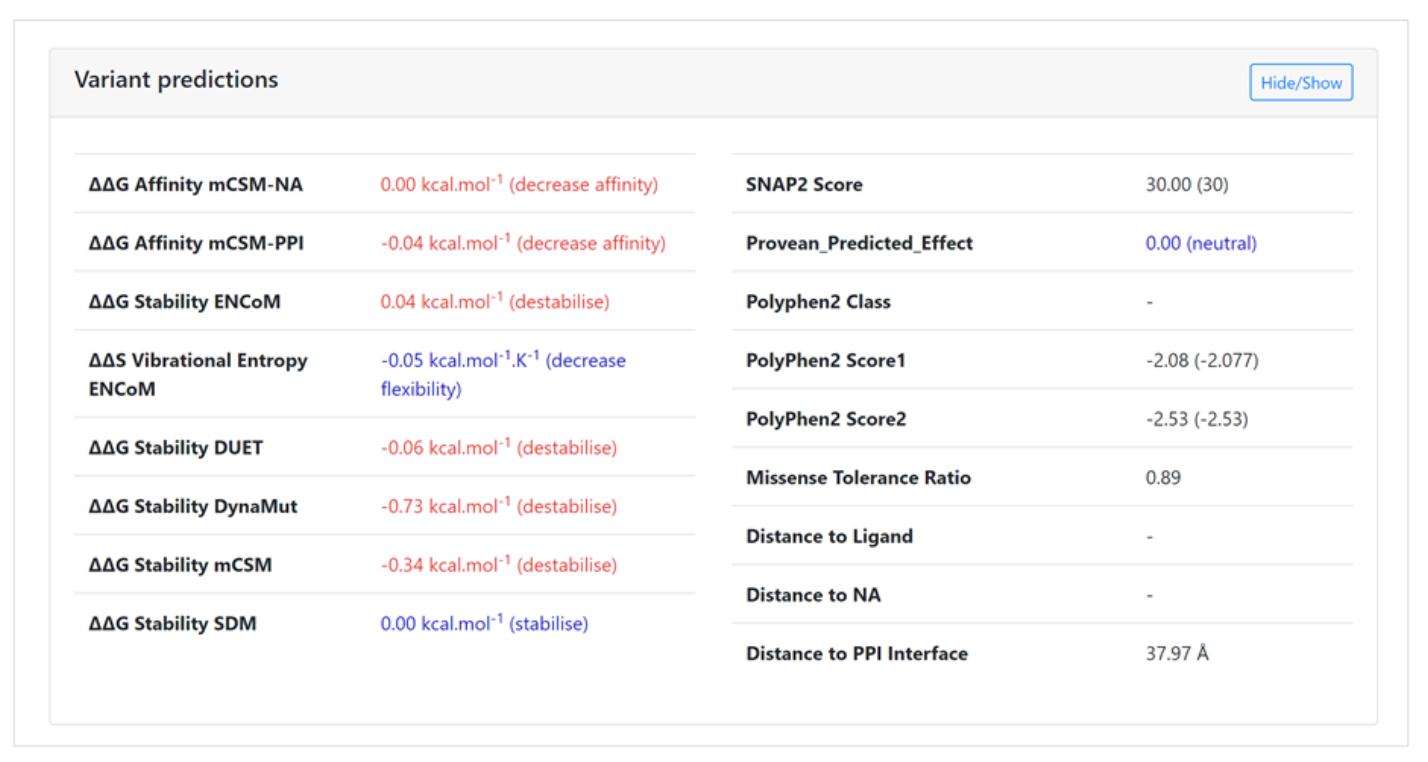
In silico predictions of the structural and functional consequences for a specific varaint
The second main section on the variant page is a list of in silico predictions displaying
the functional and structural consequences of the mutation and its corresponding pathogenicity.
Variant attribute distribution plot, highlighting the Individual calculated values associated with a given variant
The third main section on the variant page is the plot of the distribution of a specific
calculated feature of the variant (prediction) for a given gene. It also gives the value
corresponding to the variant shown on the current page.
You can select the variant feature to be shown . If the feature is numeric,
then a histogram will be displayed .When the feature is categorical a bar chart will be displayed.
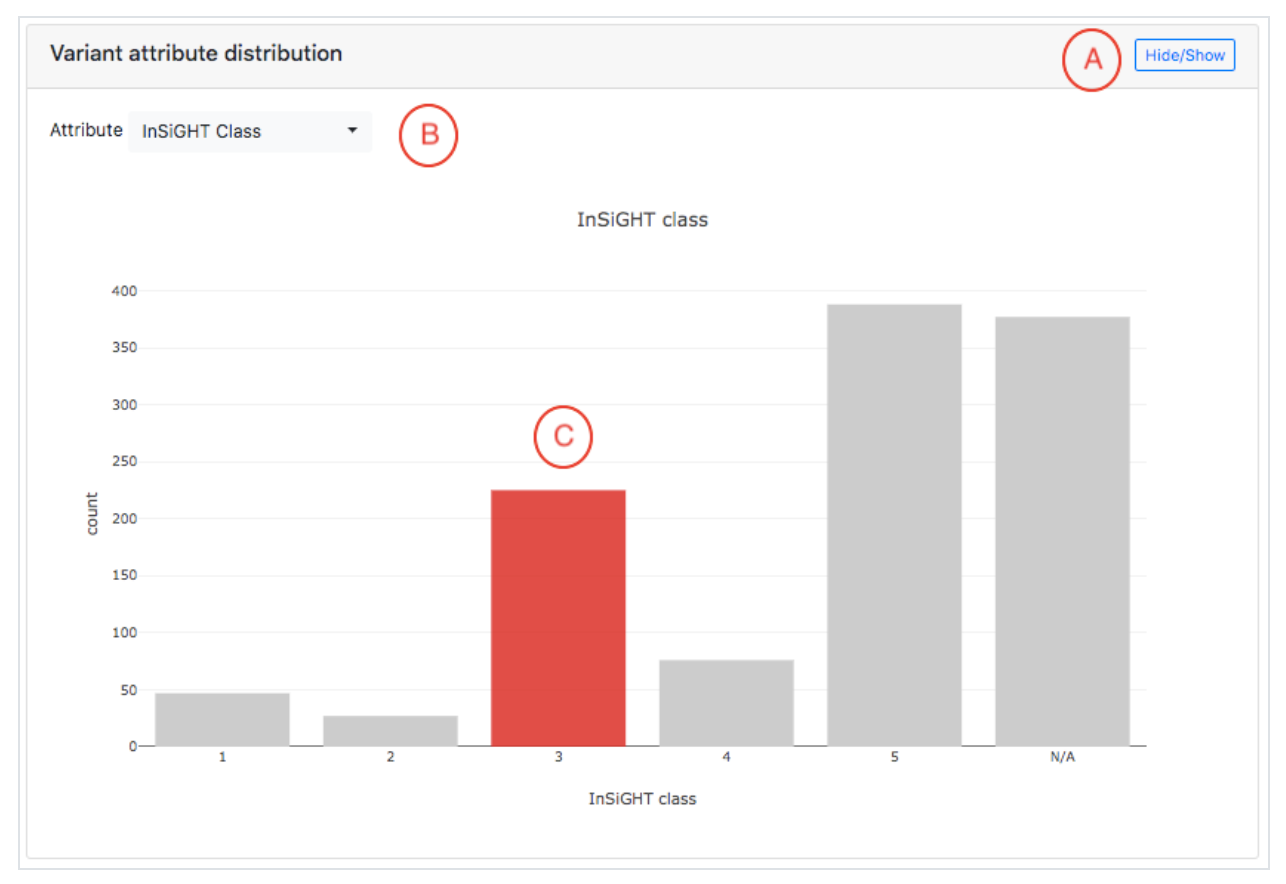
Main features of the plot are marked by letters A-C:
- The plot can be hidden or shown via the Hide/Show button.
- The specific variant feature to be shown can be chosen from the drop-down menu. Note that the resulting distribution is displayed for the gene that has the variant from the current page.
- If the mutation on the current page has a corresponding value for the selected feature,the appropriate bar that contains the value will be highlighted in red.
Software Dependencies
The strumNHEJ website uses the following software dependencies. We
are sincerely grateful to the authors of these libraries.