StructomeDB
Structome-wide pairwise protein structural and sequence comparison database
What is StructomeDB?
StructomeDB is a pre-computed database of 104,528,817 structurally detected pairs from an exhaustive all-vs-all comparison across 61,631 UniProt-linked representative protein chains drawn from the full experimental Protein Data Bank (PDB), snapshotted April 12, 2026. Pairs where neither directional Foldseek search returned a hit are absent from the database — the vast majority of possible chain combinations show no detectable structural similarity.
Each representative chain was selected by excluding chimeric chains, applying structural quality filters (minimum contiguous resolved segment > 75 residues), and retaining a single best-quality chain per UniProt accession using a hierarchical ranking procedure. The resulting set spans 7,351 species across all domains of life including viruses: Eukaryota (46.7%), Bacteria (41.1%), Viruses (6.9%), and Archaea (4.2%).
Pairwise structural similarity was assessed using Foldseek in exhaustive search mode, recording the alignment-normalised TM-score for every structural hit. Pairwise sequence similarity was independently assessed using BLASTP (E-value ≤ 10), recording percentage identity, percentage similarity, E-value, bit-score, and alignment coordinates. Both directions of each comparison were merged into a single bidirectional record per pair, with rotation matrix U and translation vector T preserved to enable instantaneous structural superimposition.
Two-Axis Classification
Each pair is placed on a two-dimensional similarity landscape:
- X axis — Structural similarity: Foldseek alignment-normalised TM-score (0–1)
- Y axis — Sequence similarity: BLASTP percentage similarity (0–1)
The landscape is divided into a 10×10 grid with 0.1-interval bins on each axis. A user-defined threshold on each axis divides the space into four biologically meaningful quadrants:
| Quadrant | Symbol | Structural | Sequence | Interpretation |
|---|---|---|---|---|
| Homologs | ++ | ≥ threshold | ≥ threshold | High structural and sequence similarity — likely evolutionarily related |
| Convergent candidates | +− | ≥ threshold | < threshold | Similar structure, dissimilar sequence — potential convergent evolution |
| Divergent candidates | −+ | < threshold | ≥ threshold | Dissimilar structure, similar sequence — conserved motif, diverged fold |
| Unrelated | −− | < threshold | < threshold | Low structural and sequence similarity |
At the default threshold of 0.5 on both axes, StructomeDB contains 611,283 homolog pairs (0.6%), 4,583,756 convergent candidates (4.4%), 126,022 divergent candidates (0.1%), and 99,207,756 unrelated pairs (94.9%).
Feature Vector
Every pair record carries a unified feature vector. Fields prefixed fs_ refer to the first-seen chain (query direction); fields prefixed ss_ refer to the second-seen chain (reverse direction).
| Field | Description |
|---|---|
hash | Deterministic 16-character MD5-based pair identifier |
first_seen_id / second_seen_id | PDB chain identifiers (PDBID_CHAIN format) |
best_alntmscore | Best-direction Foldseek alignment-normalised TM-score |
best_blastp_similarity | Corresponding BLASTP sequence similarity |
best_direction | Direction (fs/ss) from which best scores were taken |
fs_u / fs_t | Rotation matrix U and translation vector T for structural superimposition |
fs_struct_q/tstart/end | Foldseek alignment coordinates on query and target |
fs_blastp_q/hstart/end | BLASTP alignment coordinates on query and target |
fs_blastp_identity | BLASTP percentage identity |
fs_blastp_evalue | BLASTP E-value |
fs_blastp_bitscore | BLASTP bit-score |
fs_domain / ss_domain | Biological domain (Eukaryota, Bacteria, Archaea, Viruses) |
fs_pfam / ss_pfam | Pfam family annotation |
fs_scop_label / ss_scop_label | SCOP 2.08 family label |
fs_cath_code / ss_cath_code | CATH 4.4.0 domain code |
fs_uniprot_id / ss_uniprot_id | UniProt accession |
fs_tax_id / ss_tax_id | NCBI Taxonomy ID |
fs_scientific_name / ss_scientific_name | Scientific species name |
Using the Web Interface
Setting the threshold
The interactive grid on the homepage displays the pair density landscape across the full 10×10 structural × sequence similarity space. Each cell is coloured by the log₁₀ number of pairs it contains — darker cells are more densely populated.
Click or drag anywhere on the grid to move the threshold crosshair. The crosshair snaps to 0.1 increments on both axes. The quadrant counts on the right update automatically within approximately 400ms of releasing the crosshair.
Exporting data
- Set your desired threshold using the interactive grid
- Enter a random seed in the Export panel (default: 42). The same seed and threshold combination always produces the same sample, making downloads reproducible
- Click Export CSV
- Wait while the server samples up to 10,000 pairs from each occupied quadrant (maximum 40,000 rows per request) and prepares the file — this typically takes 10–30 seconds
- The CSV file downloads automatically when ready
The exported file includes the quadrant label, threshold values, seed, and the complete feature vector for every pair.
Full database access
Guided Examples
The following worked examples illustrate the two primary use cases for StructomeDB: generating labelled datasets for machine learning, and performing on-demand pairwise analysis of any two protein chains.
Use case 1: Generating labelled training data for machine learning
Machine learning models for protein function prediction, evolutionary classification, or structural bioinformatics require labelled training data — pairs with known similarity relationships assigned to meaningful categories. StructomeDB is designed for exactly this use case: set your own structural and sequence thresholds, instantly see how many pairs fall in each quadrant, and export a reproducible labelled dataset without running a single search.
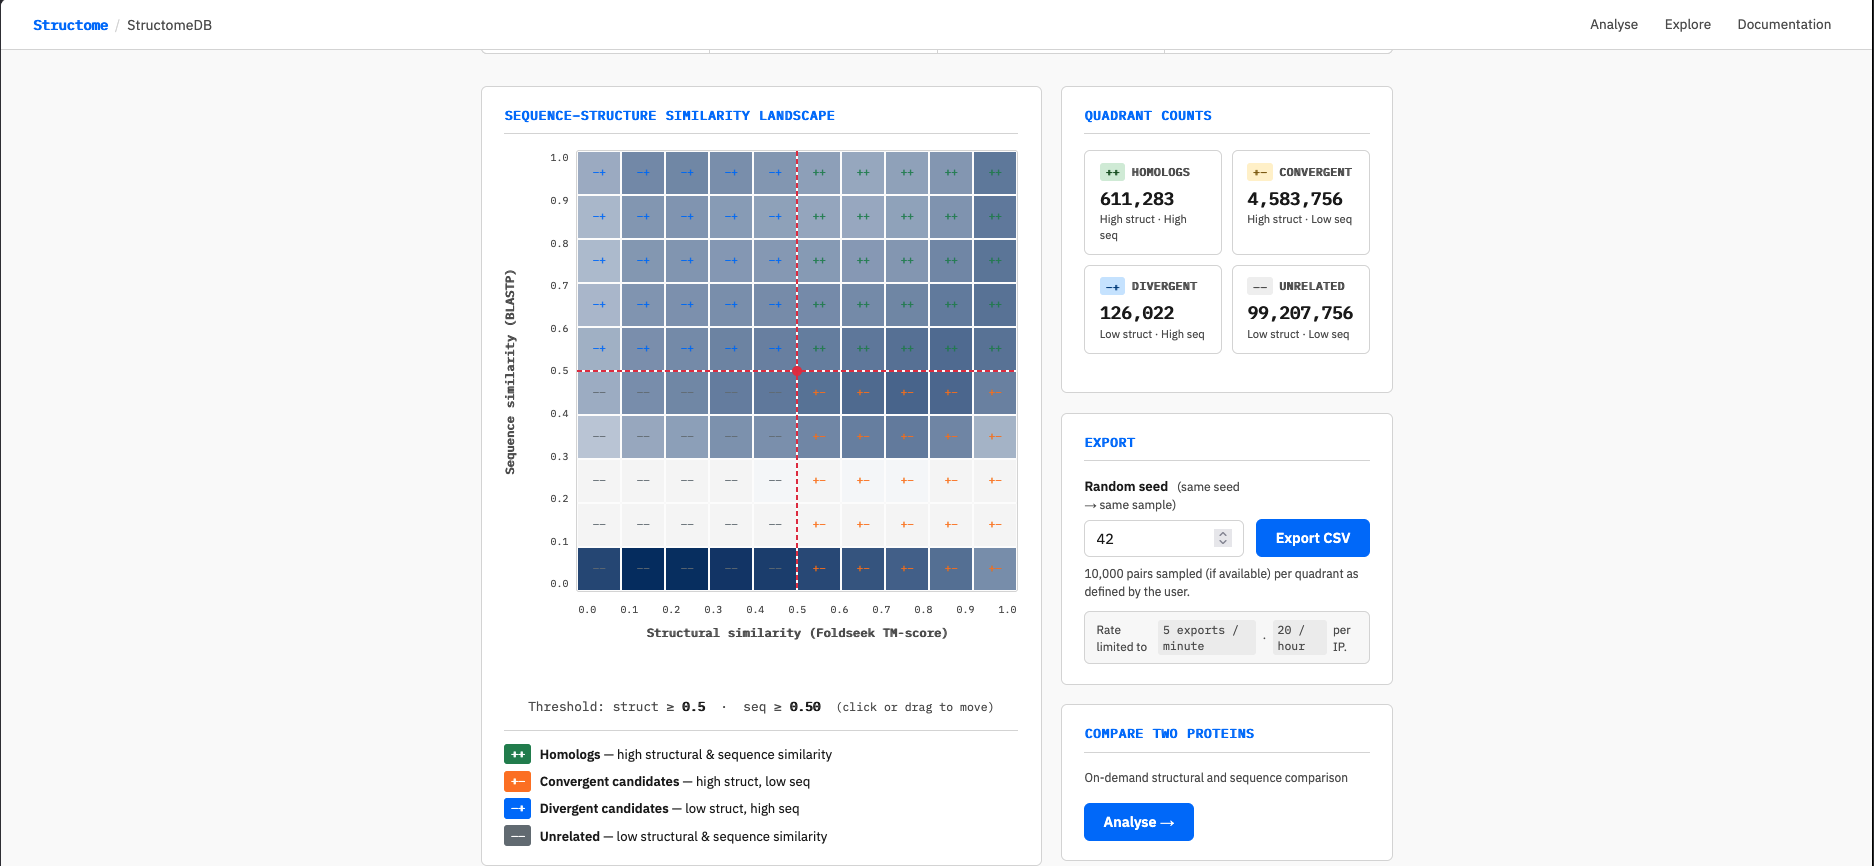
Reading the similarity landscape
The heatmap shows the full 10×10 grid of structural similarity (X axis, Foldseek TM-score) against sequence similarity (Y axis, BLASTP). Cell colour approximates pair count on a log₁₀ scale — darker cells contain more pairs.
Two features of the grid are worth noting. First, the two empty rows at low sequence similarity (roughly 0.15–0.35) reflect the BLASTP detection floor: sequence alignments below approximately 30% similarity are generally not returned, leaving those cells unpopulated. This is a biological reality, not a data gap. Second, the bottom row (sequence similarity 0.0–0.1) appears populated despite falling below the BLASTP detection floor. This is a binning artefact: pairs with no BLASTP hit are assigned a sequence similarity of 0 and therefore fall into the bottom bin. These pairs have Foldseek structural hits across the full TM-score range (0–1), which is why the bottom row is coloured — they are structurally detectable but sequence-invisible.
Setting the threshold
Click or drag anywhere on the grid to move the red crosshair. The crosshair snaps to 0.1 increments on both axes and divides the space into four labelled quadrants: ++ Homologs, +− Convergent candidates, −+ Divergent candidates, and −− Unrelated. The quadrant counts in the right panel update automatically as you move the threshold, showing exactly how many pairs fall into each category at your chosen cutoff.
Exporting labelled data
Once satisfied with your threshold, click Export CSV. The server
randomly samples up to 10,000 pairs per quadrant (up to 40,000 rows
total), assigning each row a quadrant label of ++, +-,
-+, or -- alongside the full feature vector. If a quadrant
contains fewer than 10,000 pairs at your chosen threshold — as can happen when the
crosshair is set near an extreme corner — all available pairs in that quadrant are
exported. Depending on server load, the download may take up to 30 seconds to prepare.
To obtain a different random sample at the same threshold, change the random seed in the Export panel and export again. The same seed and threshold combination always produces the same sample, making your datasets fully reproducible.
Use case 2: On-demand comparison of any two chains
The 61,631 representative chains in StructomeDB do not cover every experimentally determined protein structure. If you have a pair of interest that falls outside this set — or simply want to compare any two PDB chains interactively — the Analyse endpoint runs fresh Foldseek and BLASTP comparisons on demand and returns a full interactive result.
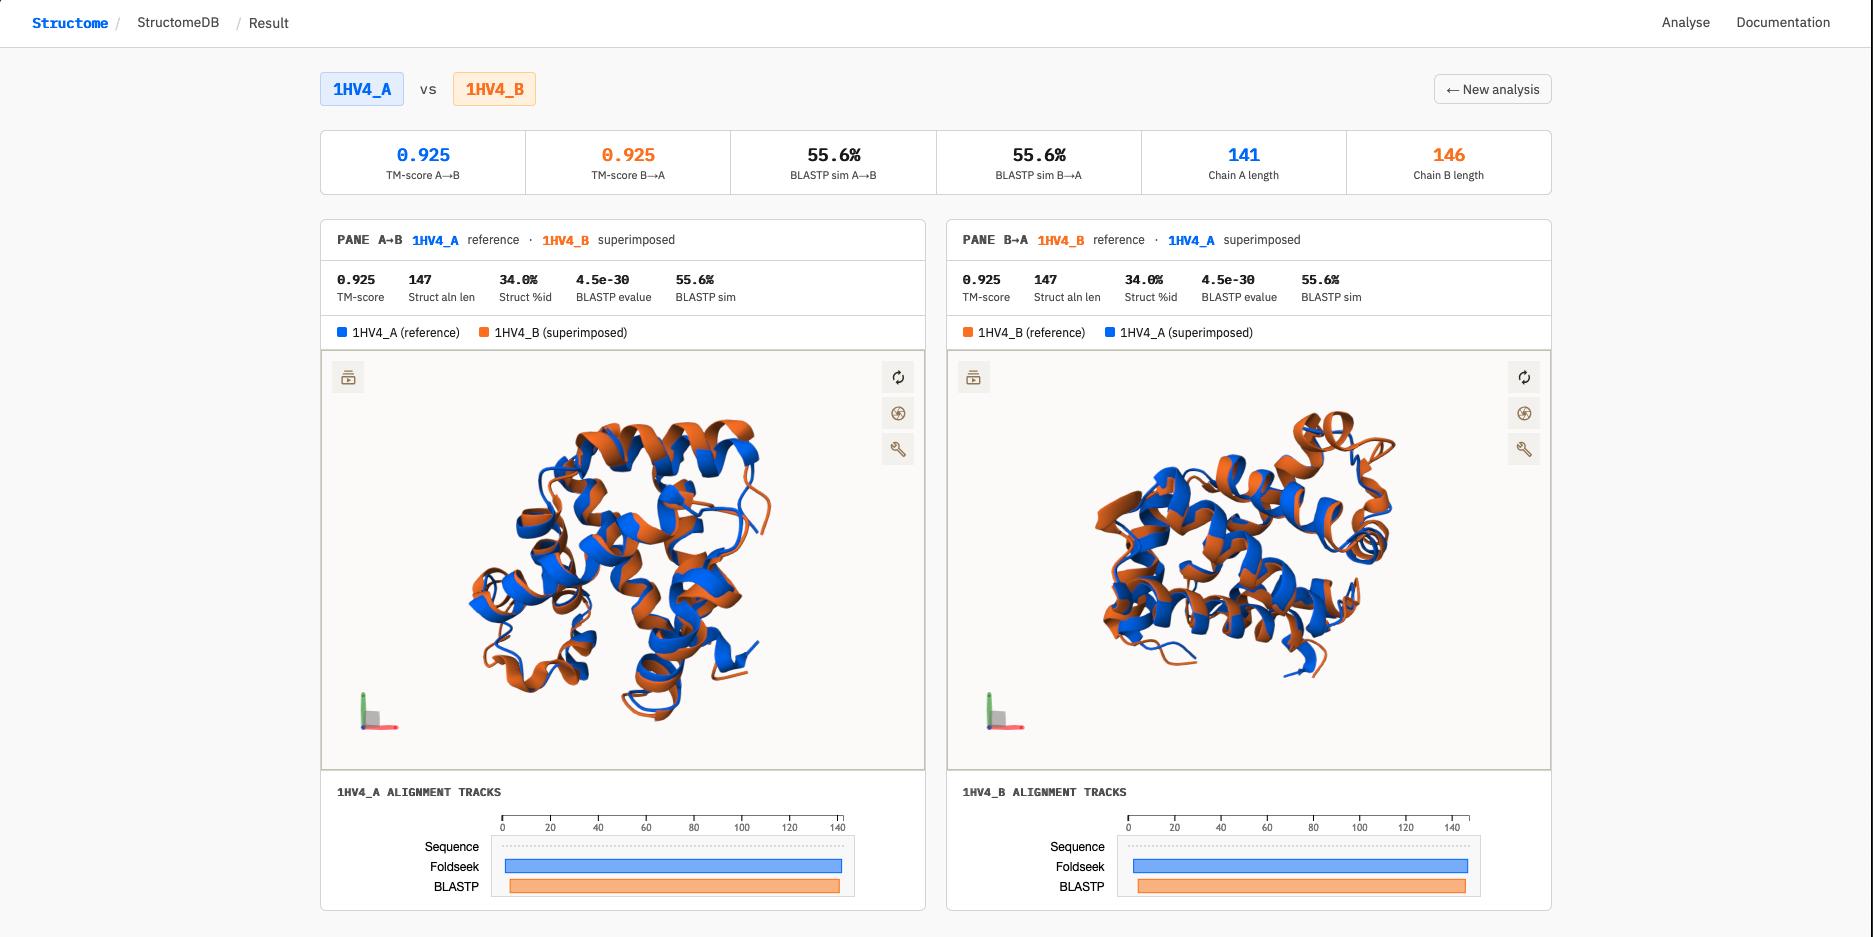
As a worked example, we compare the alpha and beta subunits of human deoxyhaemoglobin: 1HV4_A (alpha chain) and 1HV4_B (beta chain). These are paralogous globin chains — evolutionarily related but sequence-diverged — making them a useful illustration of what StructomeDB reports for pairs with high structural similarity and moderate sequence similarity.
Navigate to the Analyse page, enter
1HV4_A as Chain A and 1HV4_B as Chain B, and click
Analyse. The job typically completes in 15–30 seconds.
Reading the result page
The result page displays two panels side by side — one for each direction of comparison. This is deliberate: StructomeDB treats A→B and B→A as distinct comparisons because the TM-score is normalised to the query chain length, and both Foldseek and BLASTP may anchor their alignments to different regions of the protein depending on which chain is the query. For closely related chains of similar length (as here), both directions converge on nearly identical scores. For more divergent pairs, the two panels can differ substantially — revealing, for example, that a structural alignment anchors to the N-terminal domain in one direction but the C-terminal domain in the other.
The summary metrics strip across the top reports:
- TM-score A→B and B→A — structural similarity normalised to each query chain length
- BLASTP sim A→B and B→A — percentage of aligned positions with a positive BLOSUM62 score (ppos)
- Chain A and B lengths — number of resolved residues in each chain
For 1HV4_A vs 1HV4_B, both TM-scores are 0.925 and both BLASTP similarities are 55.6% — indicating very high structural similarity with moderate sequence similarity, consistent with paralogous globin chains that diverged from a common ancestor.
Interpreting the alignment tracks
Below each 3D viewer, a sequence feature track shows the query chain with two alignment windows overlaid:
When the two tracks overlap closely, structure and sequence are detecting similarity in the same region — a concordant signal. When they diverge, the tools are highlighting different parts of the protein: a pattern that can indicate domain insertions, deletions, or structural rearrangements between the two chains. For 1HV4_A vs 1HV4_B the tracks are near-fully concordant, as expected for two closely related globin chains.
The screenshot below shows the full result page for this comparison, including the dual-pane 3D superimposition and alignment tracks:
fs_u, fs_t,
ss_u, and ss_t.
API Reference
All endpoints are available under /structome_db/api/. Responses are JSON unless otherwise noted. Rate limits apply per IP address.
GET /api/density
Returns the precomputed 10×10 grid density table used to render the homepage heatmap. Served once on page load.
unlimited
curl https://biosig.lab.uq.edu.au/structome_db/api/density[
{"cell_id": "0.05,0.05", "count": 38762936},
{"cell_id": "0.05,0.15", "count": 21748389},
...
]GET /api/quadrant_counts
Returns the number of pairs in each quadrant for a given threshold.
60 / min · 500 / hr
| Parameter | Type | Default | Description |
|---|---|---|---|
tm | float | 0.5 | Structural similarity threshold (0–1) |
sim | float | 0.5 | Sequence similarity threshold (0–1) |
curl "https://biosig.lab.uq.edu.au/structome_db/api/quadrant_counts?tm=0.5&sim=0.5"{"pp": 611283, "pm": 4583756, "mp": 126022, "mm": 99207756}# Python
import requests
r = requests.get(
"https://biosig.lab.uq.edu.au/structome_db/api/quadrant_counts",
params={"tm": 0.5, "sim": 0.5}
)
print(r.json())GET /api/export
Samples up to 10,000 pairs from each quadrant and returns a CSV file. The same seed and threshold always produce the same sample.
5 / min · 20 / hr
| Parameter | Type | Default | Description |
|---|---|---|---|
tm | float | 0.5 | Structural similarity threshold (0–1) |
sim | float | 0.5 | Sequence similarity threshold (0–1) |
seed | int | 42 | Random seed for reproducible sampling |
# curl
curl -o structomedb_export.csv \
  "https://biosig.lab.uq.edu.au/structome_db/api/export?tm=0.5&sim=0.5&seed=42"
# Python
import requests
r = requests.get(
"https://biosig.lab.uq.edu.au/structome_db/api/export",
params={"tm": 0.5, "sim": 0.5, "seed": 42},
stream=True
)
with open("structomedb_export.csv", "wb") as f:
for chunk in r.iter_content(chunk_size=8192):
f.write(chunk)
print("Done")# R
download.file(
url = paste0("https://biosig.lab.uq.edu.au/structome_db/api/export",
"?tm=0.5&sim=0.5&seed=42"),
destfile = "structomedb_export.csv"
)
df <- read.csv("structomedb_export.csv")GET /api/health
Returns database connectivity status. Useful for monitoring.
curl https://biosig.lab.uq.edu.au/structome_db/api/health{
"status": "ok",
"databases": {
"db3": {"ok": true, "pairs": 104528817},
"db5": {"ok": true, "rows": 104528817}
}
}Analyse
What it does
The Analyse page performs an on-demand pairwise comparison between any two PDB chains you specify. Unlike the pre-computed database, this runs fresh computations at request time and works for any experimentally determined chain — not just the 61,631 representative set.
Given two chain identifiers in PDBID_CHAIN format (e.g. 1HV4_A and 4HHB_A), the backend:
- Downloads the full mmCIF files from RCSB
- Extracts the specified chains
- Runs Foldseek in both directions (A→B and B→A) using exhaustive search
- Runs BLASTP in both directions
- Applies the Foldseek rotation matrix U and translation vector T to superimpose each structure onto the other
- Returns an interactive dual-pane viewer with alignment tracks
Jobs are asynchronous — after submission the page polls for completion and redirects automatically. Jobs expire after one hour.
Metrics
Results are displayed across two panels — left pane shows Chain A as reference with Chain B superimposed; right pane shows Chain B as reference with Chain A superimposed.
Summary strip — top-level metrics across both directions:
Per-pane metrics — direction-specific scores shown above each viewer:
| Metric | Source | Description |
|---|---|---|
TM-score | Foldseek | Alignment-normalised TM-score for this direction. Values closer to 1.0 indicate stronger structural similarity. TM-score is length-normalised and therefore comparable across pairs of different sizes. |
Struct aln len | Foldseek | Number of residue pairs included in the structural alignment. The TM-score and structure-guided identity are both computed over this window. |
Struct aln %id | Foldseek | Sequence identity computed only within the structural alignment window — identical residues divided by structural alignment length. This is a structure-guided metric: residue pairings come from the 3D superimposition, not from a sequence alignment algorithm. It answers the question "of the positions where these structures agree geometrically, how many are also the same amino acid?" Note this differs from global BLASTP identity. |
BLASTP e-value | BLASTP | Expect value for the best sequence alignment hit. Lower values indicate more statistically significant sequence similarity. |
BLASTP sim | BLASTP | Percentage of aligned positions that are either identical or have a positive BLOSUM62 substitution score (ppos). This is the primary sequence similarity axis used throughout StructomeDB. |
Alignment tracks — below each viewer, a Saguaro sequence feature viewer shows the query chain sequence with two alignment tracks overlaid:
Comparing the two tracks reveals whether the structural and sequence alignments are co-localised on the protein — a divergence between them can indicate domain-level structural rearrangement or the presence of an inserted/deleted region.
POST /api/analyse/submit
Submit an analysis job. Accepts JSON body or query parameters.
| Parameter | Type | Required | Description |
|---|---|---|---|
chain_a | string | yes | First chain in PDBID_CHAIN format (e.g. 1HV4_A) |
chain_b | string | yes | Second chain in PDBID_CHAIN format (e.g. 4HHB_A) |
curl -X POST https://biosig.lab.uq.edu.au/structome_db/api/analyse/submit \
  -H "Content-Type: application/json" \
  -d '{"chain_a": "1HV4_A", "chain_b": "4HHB_A"}'
{"job_id": "747d8bc4-7e82-41e5-996c-e571572e6e6b", "status": "queued"}# Python
import requests, time
r = requests.post(
"https://biosig.lab.uq.edu.au/structome_db/api/analyse/submit",
json={"chain_a": "1HV4_A", "chain_b": "4HHB_A"}
)
job_id = r.json()["job_id"]
print("Job:", job_id)GET /api/analyse/status/<job_id>
Poll the status of a running job. Typical job completion time is 15–45 seconds depending on chain length.
| Status value | Meaning |
|---|---|
queued | Job accepted, not yet started |
running | Job in progress — msg field gives current step |
done | Complete — result is available |
error | Job failed — msg field contains the error |
curl https://biosig.lab.uq.edu.au/structome_db/api/analyse/status/747d8bc4-7e82-41e5-996c-e571572e6e6b{"status": "running", "msg": "Running Foldseek A→B...", "chain_a": "1HV4_A", "chain_b": "4HHB_A"}# Python — poll until done
while True:
s = requests.get(
f"https://biosig.lab.uq.edu.au/structome_db/api/analyse/status/{job_id}"
).json()
print(s["status"], s["msg"])
if s["status"] in ("done", "error"):
break
time.sleep(3)GET /api/analyse/result/<job_id>
Returns the full result JSON once a job has status done. Jobs expire after one hour.
curl https://biosig.lab.uq.edu.au/structome_db/api/analyse/result/747d8bc4-7e82-41e5-996c-e571572e6e6b{
"chain_a": "1HV4_A",
"chain_b": "4HHB_A",
"seq_a": "VLSPADKTNVKAAWGKVGAHAGEYGAEALERMFLSFPTTKTYFPHFDLSHGSAQVKGHGKKVADALTNAVAHVDDMPNALSALSDLHAHKLRVDPVNFKLLSHCLLVTLAAHLPAEFTPAVHASLDKFLASVSTVLTSKYR",
"seq_b": "VLSPADKTNVKAAWGKVGAHAGEYGAEALERMFLSFPTTKTYFPHFDLSHGSAQVKGHGKKVADALTNAVAHVDDMPNALSALSDLHAHKLRVDPVNFKLLSHCLLVTLAAHLPAEFTPAVHASLDKFLASVSTVLTSKYR",
"ab": {
"alntmscore": 0.812,
"u": [[...], [...], [...]],
"t": [...],
"qstart": 1, "qend": 141,
"tstart": 1, "tend": 141,
"pident": 84.1,
"alnlen": 138,
"evalue": 2.3e-67,
"bits": 241.0
},
"ba": { "..." },
"blastp_ab": {
"pident": 83.2,
"ppos": 83.2,
"alnlen": 141,
"qstart": 1, "qend": 141,
"tstart": 1, "tend": 141,
"evalue": 2.3e-67,
"bits": 241.0
},
"blastp_ba": { "..." }
}Rate Limits
| Endpoint | Per minute | Per hour |
|---|---|---|
/api/density | unlimited | unlimited |
/api/quadrant_counts | 60 | 500 |
/api/export | 5 | 20 |
Exceeding rate limits returns HTTP 429. For bulk programmatic access or the full database please contact the authors.
Licence
StructomeDB is released under the Creative Commons CC0 1.0 Universal licence. The database is freely available to all users with no restrictions on use, redistribution, or incorporation into downstream resources.
Contact
Ashar Malik
ashar.malik@uq.edu.au
BioSig Lab · The University of Queensland