School of Chemistry and Molecular Biosciences, The University of Queensland
What is MissenseDB?
MissenseDB is a proteome-wide database of human missense variant effect predictions integrating three state-of-the-art computational predictors — AlphaMissense (AM), VESM, and VESPA — across 19,436 UniProtKB/Swiss-Prot human protein entries. Per-variant scores are retained on each predictor's native scale and converted to a common calibrated 0–1 scale (higher = more pathogenic; see Empirical Score Calibration), and are mapped onto experimental and AlphaFold-predicted protein structures for 3D visualisation.
For each position in every protein, MissenseDB precomputes a residue mutational-sensitivity score for each predictor — the mean of its calibrated scores across all 19 possible amino acid substitutions — and the mean of these scores across the three predictors, providing a position-level summary of mutational intolerance independent of any specific observed variant. Calibrated scores are obtained by empirical binning of each predictor's raw score against HUMSAVAR LP/P and LB/B labels (see Empirical Score Calibration). For backward compatibility, position-level scores on a global per-predictor min-max normalised scale (VESM log-likelihood ratios inverted, values clipped to [0, 1]) are also stored. Structural annotations (DSSP secondary structure, ligand proximity), domain assignments (Pfam), and clinical variant data (HUMSAVAR, dbSNP, ClinVar) are integrated to enable both per-protein inspection and proteome-wide programmatic discovery.
The three predictors are:
- AlphaMissense (AM) — Cheng et al., Science 2023. A structure-informed pathogenicity classifier built on AlphaFold2, fine-tuned on population frequency and functional data. Scores represent the probability of pathogenicity.
- VESM — A sequence-only protein language model trained by co-distillation across the ESM family, compressing collective evolutionary knowledge into a single 3-billion parameter model. Raw scores are log-likelihood ratios; higher (more positive) values indicate more tolerated substitutions. On the calibrated 0–1 scale the orientation is reversed so that 1 = most pathogenic, consistent with AM and VESPA.
- VESPA — Marquet et al., Human Genetics 2022. T5 protein language model embedding-based predictor combining conservation and substitution signals. Scores represent predicted pathogenicity probability.
Comparison with Related Resources
No comparable resource combines three complete variant-effect predictor landscapes — AlphaMissense, VESM and VESPA — a position-level mutational intolerance map, synchronised multi-structure views, and composable proteome-wide querying in a single persistent precomputed database. ProtVar, dbNSFP and CATVariant each address complementary use cases; the table below summarises how MissenseDB differs.
| Capability | MissenseDB | ProtVar | CATVariant | dbNSFP |
|---|---|---|---|---|
| Structure-first design | ✅ | ❌ | ❌ | ❌ |
| DSSP from 3D atomic coordinates | ✅ | ⚠️ seq-predicted | ⚠️ seq-predicted | ❌ |
| Multi-structure position mapping | ✅ 211,731 | ⚠️ 1 structure | ⚠️ 1 structure | ❌ |
| Precomputed ligand proximity | ✅ | ⚠️ UniProt only | ⚠️ UniProt only | ❌ |
| VESM | ✅ | ❌ | ❌ | ❌ |
| Position-level mean variant-effect score | ✅ | ❌ | ⚠️ per-variant | ❌ |
| All 19 substitutions per position | ✅ | ❌ observed only | ❌ observed only | ⚠️ genomic only |
| Pfam as queryable API dimension | ✅ | ❌ | ❌ | ❌ |
| HUMSAVAR clinical variants | ✅ | ❌ | ❌ | ❌ |
| Proteome-wide cross-filtering API | ✅ | ❌ per-variant | ❌ per-protein | ❌ flat file |
| Instant precomputed response | ✅ | ✅ | ⚠️ ~30 min | ✅ |
✅ fully supported · ⚠️ partial or different implementation · ❌ absent.
Data Sources
| Source | Version / Release | Content |
|---|---|---|
| UniProtKB/Swiss-Prot | 2024_06 (canonical sequences only; alternative isoforms are excluded as AM and VESM scores are released on canonical sequences) | 19,436 human protein sequences and annotations |
| AlphaMissense | Downloaded October 2023 | Per-variant pathogenicity scores for all human Swiss-Prot proteins |
| VESM | 3B | Per-variant log-likelihood ratio scores |
| VESPA | v1 | Per-variant pathogenicity probability scores |
| AlphaFold | v6 | Predicted structures for all 19,436 proteins |
| PDB / SIFTS | April 2026 | Experimental structures and UniProt–PDB residue mappings. The 211,731 structure mappings reported represent UniProt-to-PDB chain-level mappings (1:N); chimeric chains are excluded and alternative isoforms are not mapped. |
| DSSP | 4.0 | Secondary structure and solvent accessibility per residue |
| HUMSAVAR | 2026_01 | 84,476 curated human missense variants with ACMG/AMP classifications |
| dbSNP | 157 | Population frequencies (gnomAD, TOPMed, 1000 Genomes, TOMMO) and ClinVar assertions |
| Pfam | 36.0 | Domain annotations via SIFTS UniProt–Pfam mapping |
Update policy
MissenseDB is updated annually. Each release incorporates accumulated updates to PDB, AlphaFold, UniProt Swiss-Prot, HUMSAVAR, SIFTS, Pfam, dbSNP and ClinVar over the preceding year. The current release versions are listed in the Data Sources table above. A changelog will be maintained on this page between releases.
Variant Processing Pipeline
MissenseDB integrates HUMSAVAR release 2026_01 (28-Jan-2026). HUMSAVAR was chosen as the clinical annotation backbone because it provides expert-curated ACMG/AMP classifications tied directly to UniProt canonical sequences, offering stable protein-coordinate anchoring and consistent variant nomenclature across releases. For HUMSAVAR variants that carry an rsID, the corresponding dbSNP record is fetched to enrich each variant with population allele frequencies and per-submission ClinVar significance calls. Not all HUMSAVAR variants appear in the queryable database — the following pipeline explains each filtering step and the resulting counts.
dbSNP build 157 rsID matching
~23.3% have no rsID → excluded
MANE-select transcript consequence annotation
Using the Web Interface
Searching for a protein
Enter a UniProtKB accession (e.g. P04637) in the search box on the
home page. Autocomplete suggestions appear after
two characters — only proteins present in MissenseDB are shown. Press Enter or click
Visualise to load the results page.
Results page layout
The results page is divided into three areas:
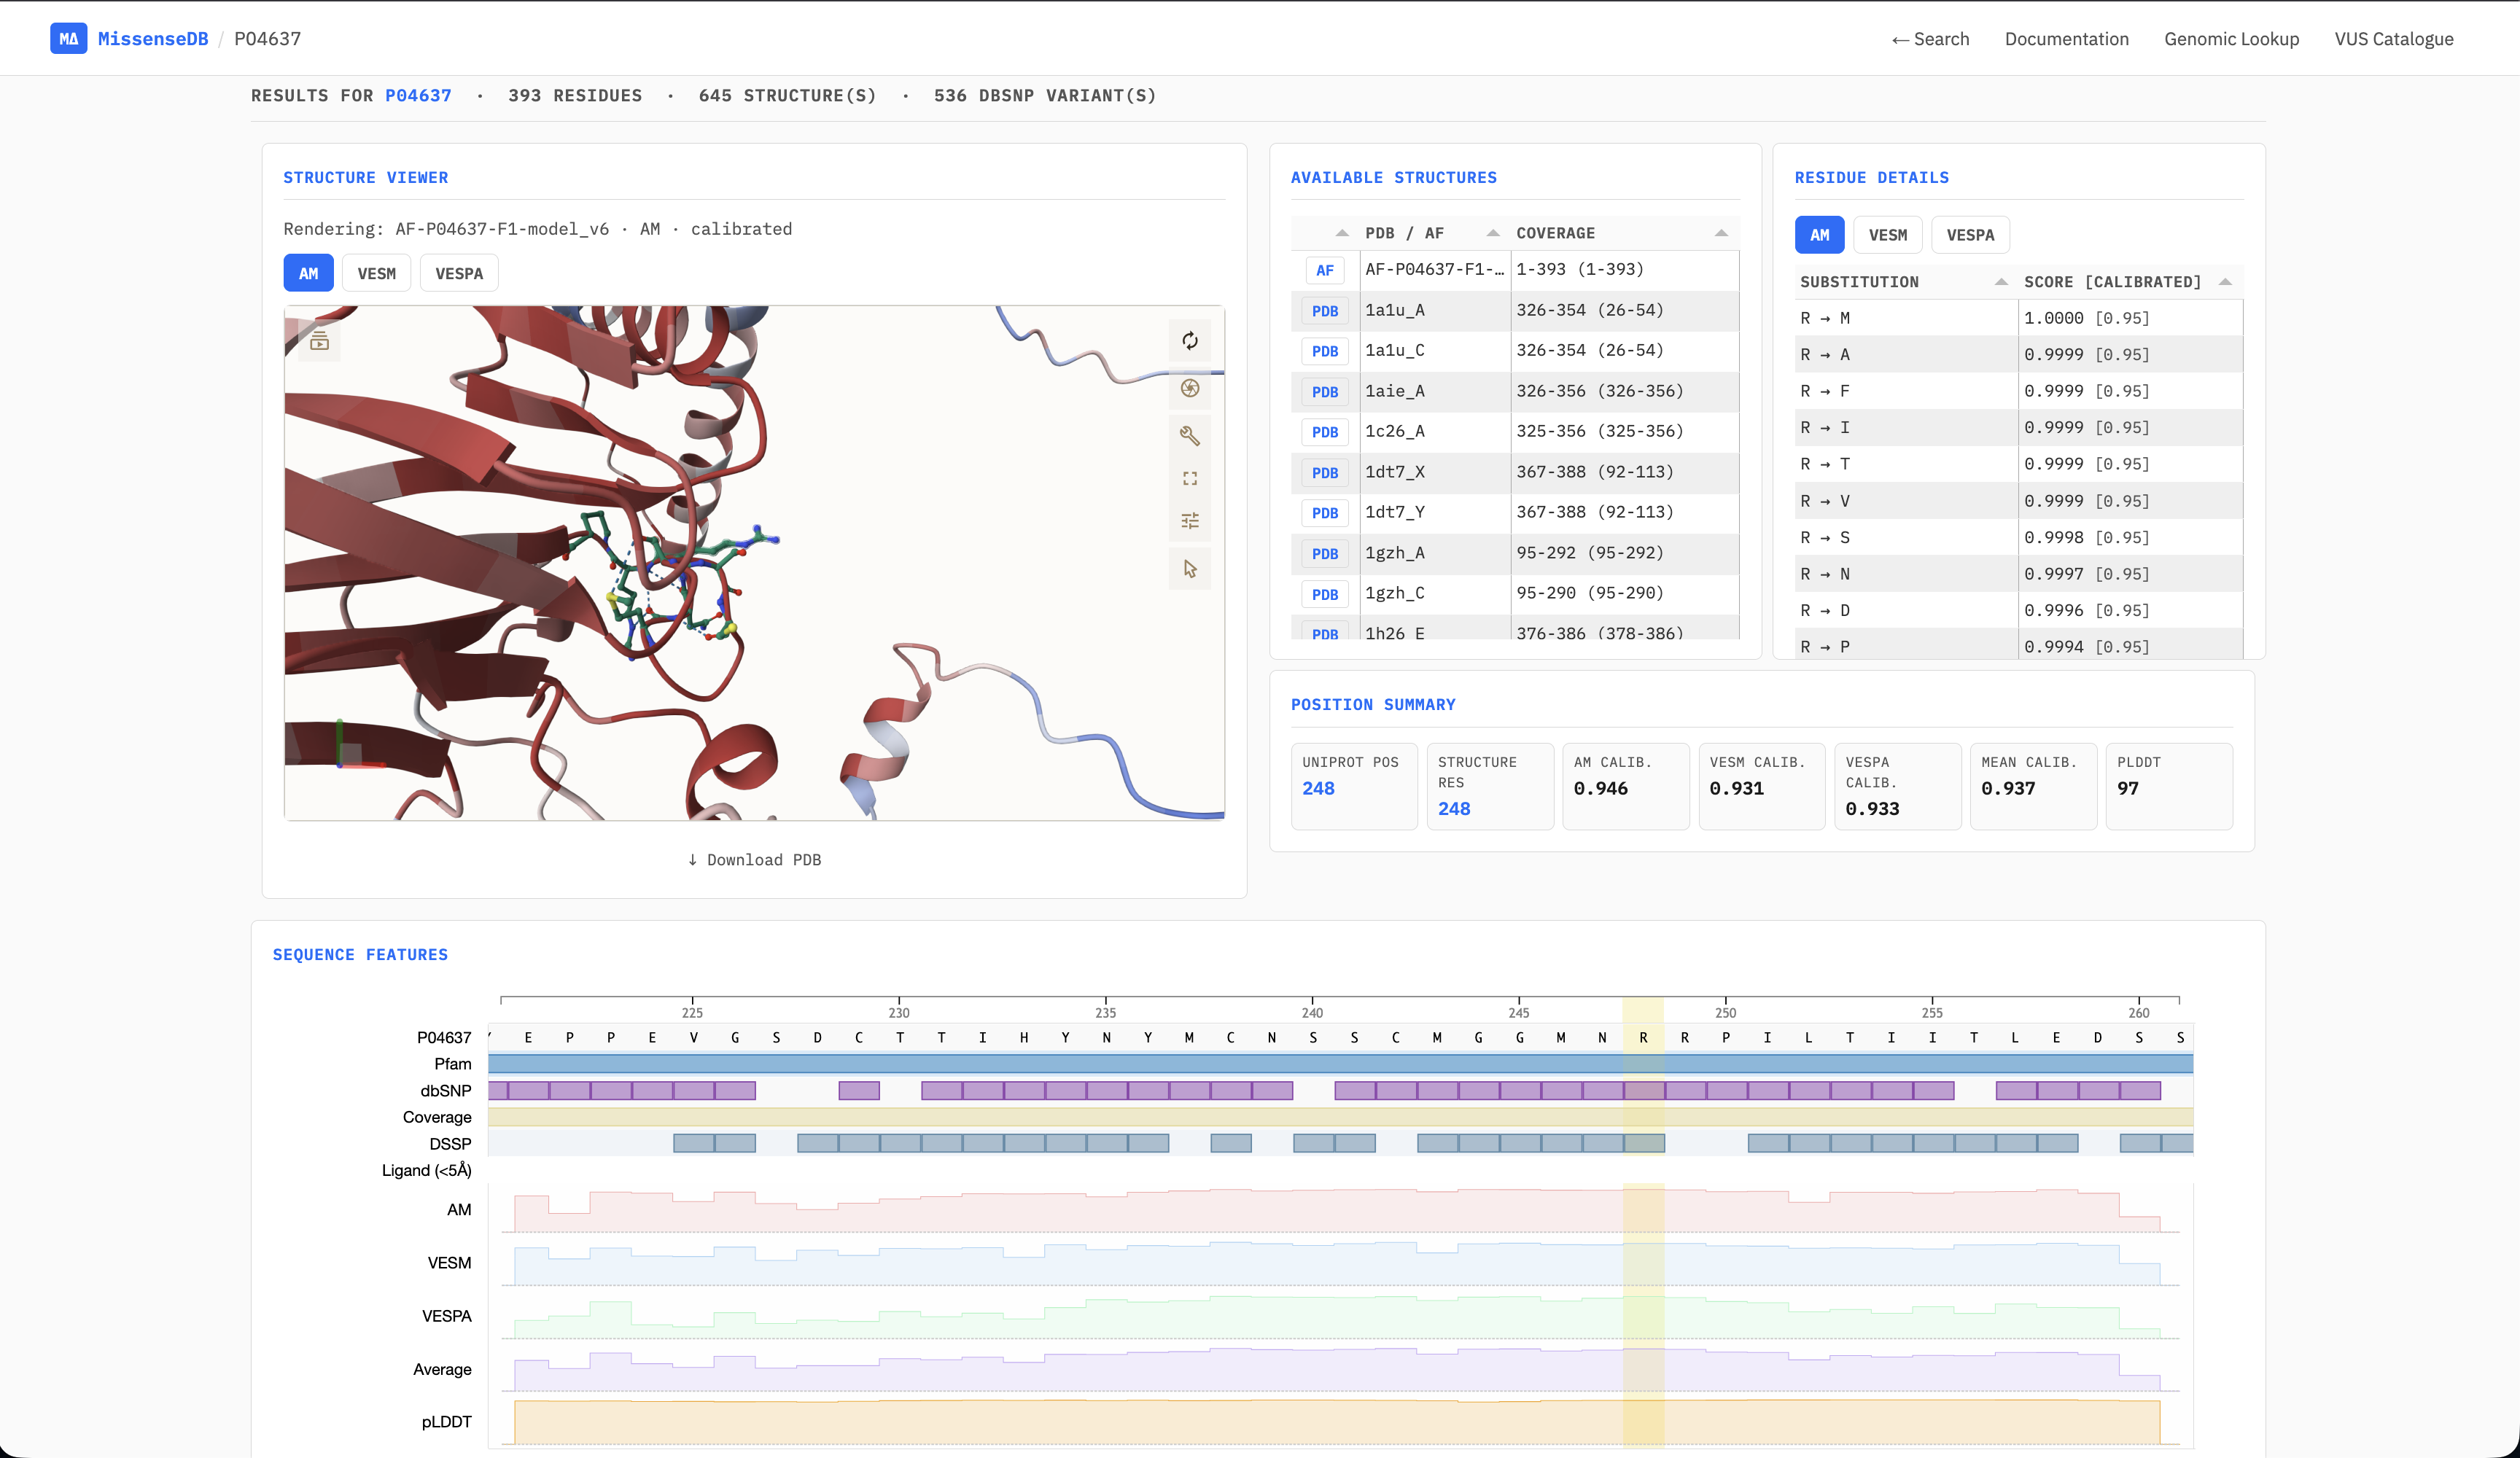
- Structure viewer (left) — Mol* 3D viewer rendering the AlphaFold or experimental PDB structure coloured by the calibrated residue score (0–1, higher = more pathogenic; B-factor channel). Switch between AM, VESM, and VESPA colouring using the predictor buttons. Click any structure in the Available Structures table to load it.
- Residue detail panels (right) — the top-right panel shows all 19 substitution scores at the clicked residue position for the selected predictor, sorted by raw score. Each raw score is followed, in brackets, by its calibrated pathogenicity probability (0.5 = decision boundary), so the three predictors can be compared on a common scale. The position summary strip below shows the calibrated AM, VESM, VESPA and mean scores at that position (the mean of the 19 calibrated substitution scores), the UniProt position, the mapped structure residue number and the pLDDT. This is only activated after a single position column is selected from the feature viewer in the second row.
- Sequence feature viewer (bottom) — an RCSB Saguaro 1D track viewer showing the full protein sequence with overlaid annotation tracks. Click any position in the sequence track to select it — this synchronises the 3D viewer highlight, the residue detail table, and the position summary.
Sequence feature tracks
| Track | Colour | Description |
|---|---|---|
| Sequence | Grey | Full UniProt amino acid sequence; click to select a position |
| Pfam | Blue | Pfam domain intervals; hover for domain name and accession |
| dbSNP | Purple | Positions with HUMSAVAR/dbSNP annotated variants |
| Coverage | Yellow | UniProt residue range covered by the currently loaded structure |
| DSSP | Steel blue | DSSP secondary-structure assignment for the loaded structure |
| Ligand (<5 Å) | Orange | Residues within 5 Å of a HETATM record (ligand, ion or crystallographic water) in the loaded structure |
| AM | Pink | AlphaMissense calibrated residue score per position (mean of the 19 calibrated substitution scores, 0–1) |
| VESM | Light blue | VESM-3B calibrated residue score per position (0–1) |
| VESPA | Green | VESPA calibrated residue score per position (0–1) |
| Average | Purple | Mean of the three calibrated residue scores (0–1) |
| pLDDT | Amber | AlphaFold per-residue confidence (pLDDT) |
Downloading score-annotated structures
For each protein, calibrated residue scores are mapped into the B-factor column of
the corresponding structure files, producing three score-annotated PDB files
— one per predictor (AM, VESM, VESPA). Calibrated scores (0–1) are written to the
B-factor column multiplied by 100, so values lie between 0 and 100. These can be downloaded directly from
the results page using the Download PDB button beneath the structure viewer.
Downloaded files can be opened in any molecular visualisation software
(PyMOL, ChimeraX, VMD) and coloured by B-factor to reproduce the
MissenseDB score mapping. The structure identifier, predictor and
calibrated are encoded in the filename.
dbSNP variant panel
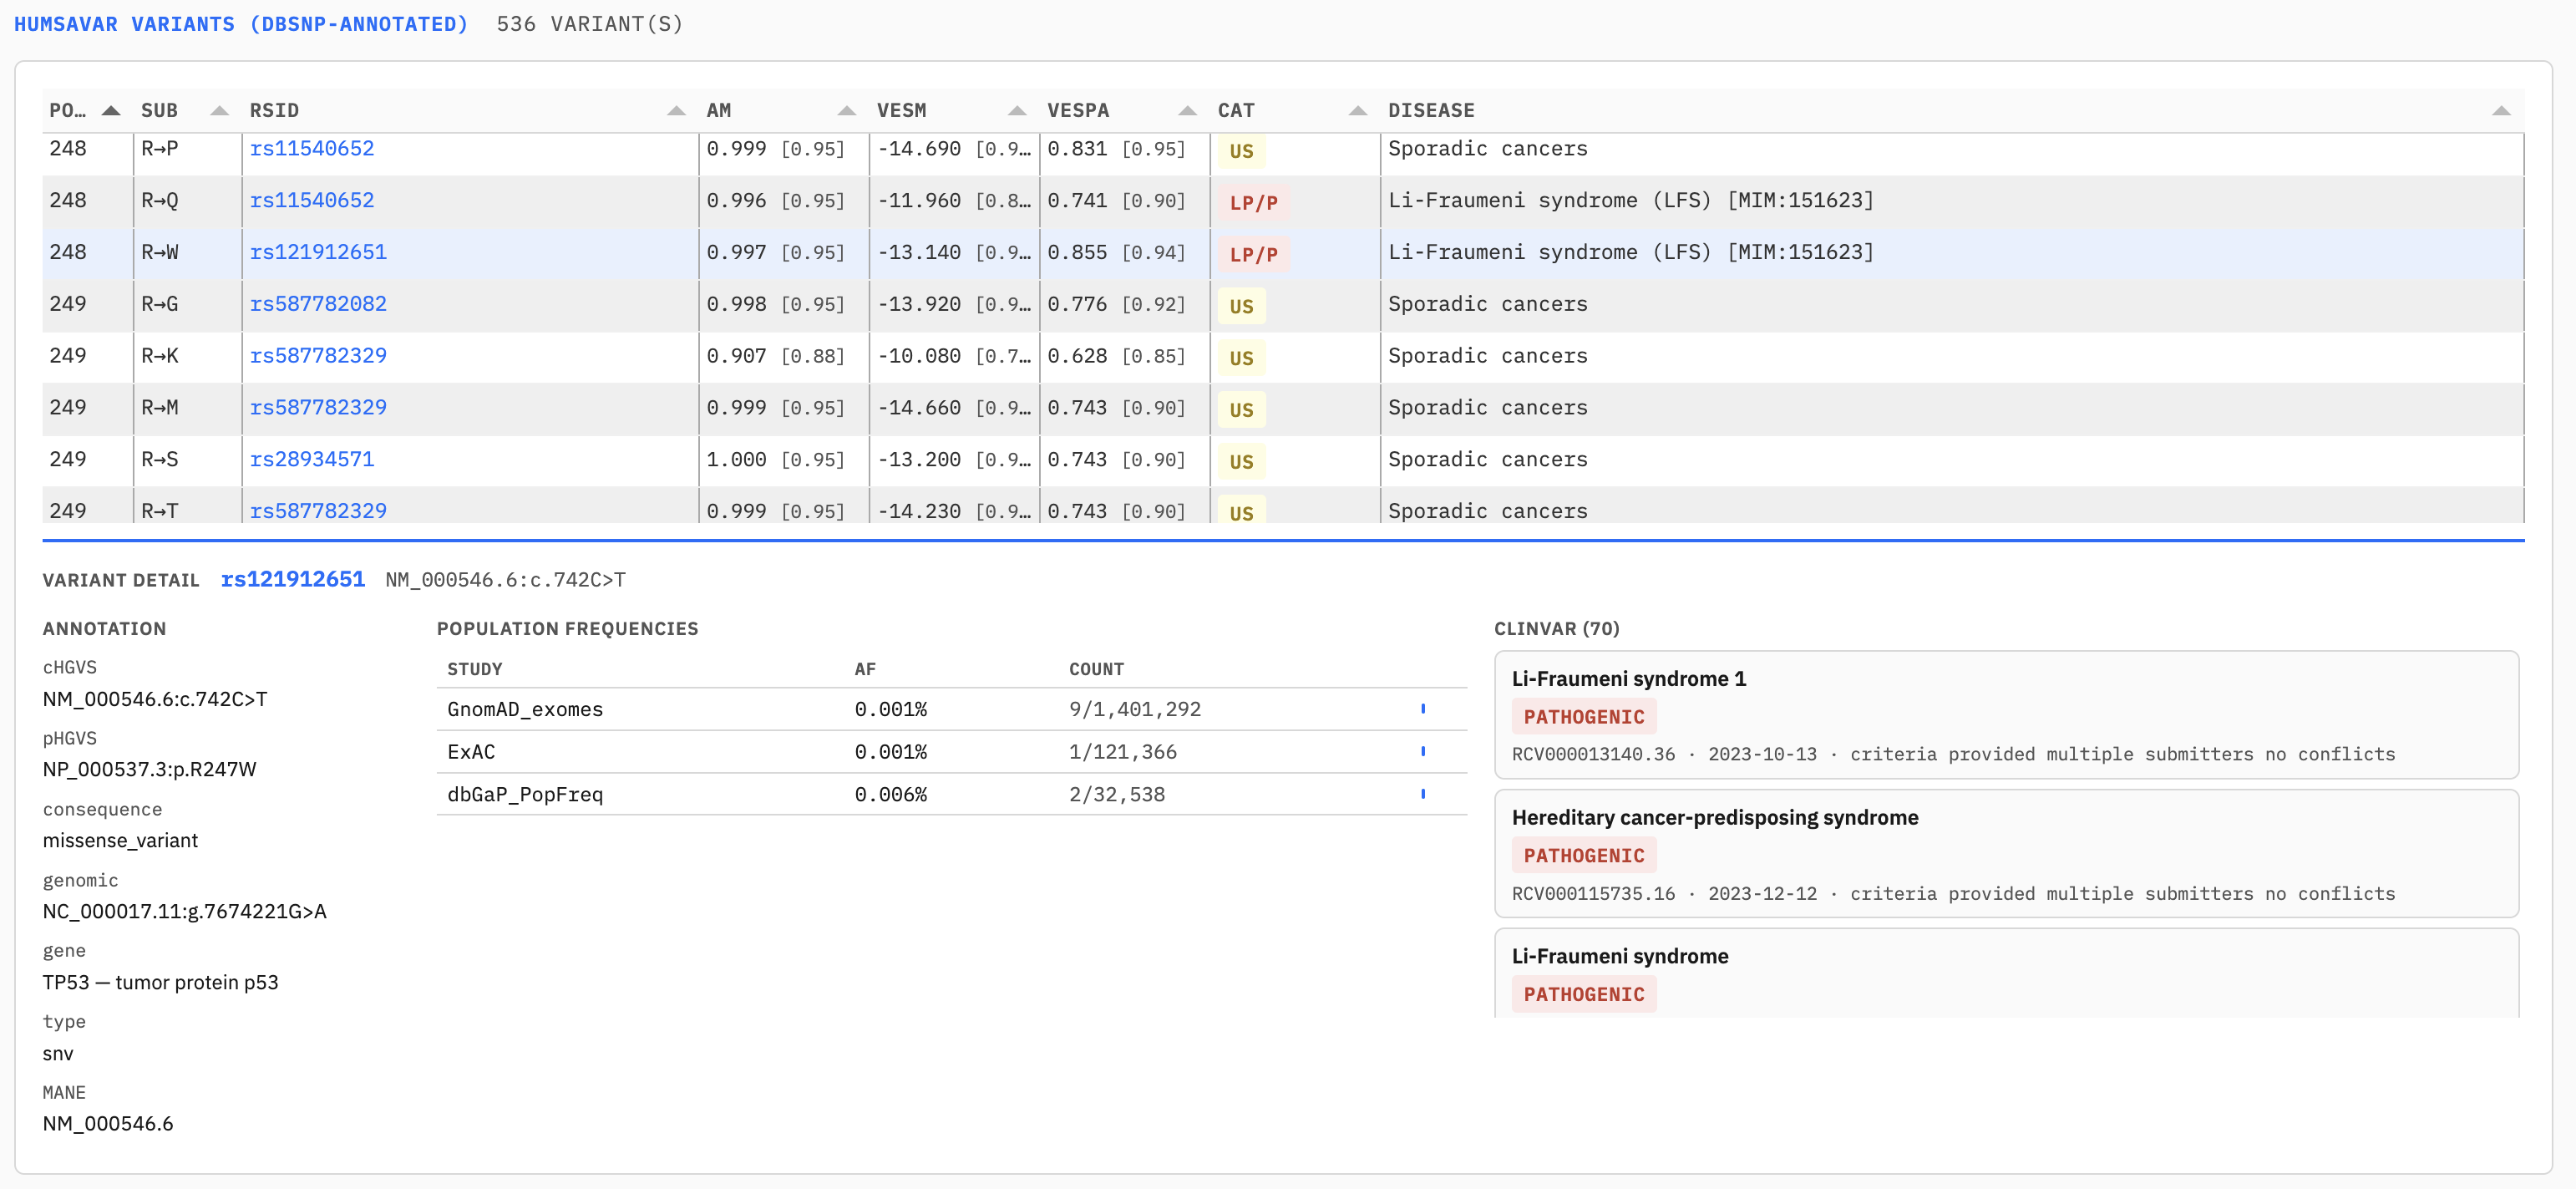
For proteins with HUMSAVAR-annotated variants, a dbSNP Variants section appears below the sequence viewer. The full-width table lists all annotated substitutions with their ACMG/AMP classification, rsID, AM/VESM/VESPA/mean scores, and disease association. Click any row to expand the detail panel showing population allele frequencies across multiple cohorts (gnomAD, TOPMed, 1000 Genomes, TOMMO and others) and all ClinVar submissions with significance classifications.
Genomic coordinate lookup
The Genomic Lookup page maps GRCh38
nucleotide positions to UniProt residues and retrieves predictor annotations
for each mapped position. Enter one coordinate per line in any of the accepted
formats (chr17:7674220, 17:7674220,
chr17 7674220) — up to 5,000 per submission. Tick
Include calibrated predictor scores to add the calibrated AM, VESM,
VESPA and mean residue scores (each the mean of the 19 calibrated substitution
scores at that residue), together with pLDDT, DSSP secondary structure, and ligand
proximity, to each mapped residue.
Results are displayed in a filterable table with status indicators
(mapped / unmapped / invalid) and can be downloaded as TSV. Click any mapped
UniProt ID in the results table to open the full MissenseDB results page for
that protein. Programmatic access is available via the POST /api/db/gencord
endpoint described in the API Reference and the non-programmer guide above.
VUS Catalogue
The VUS Catalogue page provides predictor annotations for all HUMSAVAR variants classified as uncertain significance (US). Each variant is independently evaluated by AlphaMissense (AM), VESM-3B, and VESPA using its own calibrated substitution score, with a shared threshold of ≥ 0.50 across all three predictors after empirical binning calibration (see Empirical Score Calibration). Score colours reflect the binary P/B call at this threshold rather than generic numerical ranges: red indicates a high-effect (P) call and green a low-effect (B) call. The consensus column records the pattern of calls across the three predictors: 3P indicates three high-effect calls; 2P · 1B and 1P · 2B indicate predictor disagreement; and 3B indicates three low-effect calls. Consensus filter buttons allow users to focus on concordant or discordant subsets, and the complete active view can be downloaded as TSV for further analysis. These predictor calls are computational annotations and should not be interpreted as clinical reclassification of HUMSAVAR variants.
Guided Examples
Use case 1 — Clinical variant interpretation (TP53, P04637)
This example walks through interpreting a known pathogenic variant in TP53 — one of the most clinically studied tumour suppressor genes — using the MissenseDB web interface. TP53 R248W is a well-characterised Li-Fraumeni syndrome variant (rs28934578) used here to illustrate the full workflow.
P04637 in the search box. Select the autocomplete suggestion
and press Search.
rs28934578.
The ACMG category shows LP/P. Click the row to expand
the detail panel.
Use case 2 — Proteome-wide discovery via API
This example demonstrates programmatic access to MissenseDB to identify all LP/P variants in the proteome that lie within alpha-helices and carry high variant-effect scores — a query relevant to structural interpretation of disease variants and not feasible from a single-protein GUI view.
The workflow combines two API endpoints: /api/db/scan from DB1
to find high-score alpha-helical positions, and /api/db/variants/category/LP/P
from DB2 to retrieve pathogenic variants, then intersects the two sets.
Step 1 — Fetch all alpha-helical positions with high variant-effect score
Step 2 — Fetch all LP/P variants with population frequency data
Step 3 — Intersect: LP/P variants in high-score helical positions
Use case 3 — Structural discovery: high-effect positions near bound ligands
This example illustrates the composable query model of MissenseDB. Each residue position is an independently queryable record linked to predictor scores, structural context, domain annotations, population frequencies and clinical evidence. Queries that span these dimensions simultaneously — such as finding disease-associated variants at structurally constrained, ligand-proximal positions — are answered in a single API call and are not feasible from per-protein GUI tools.
Step 1 — Find all high-effect positions proximal to a bound ligand
Step 2 — Retrieve LP/P variants at those positions
Other queries answerable via the same composable API include: positions where all
three predictors agree within a specific secondary structure element
(dssp=E&min_cal_load=0.9); disease-associated variants in structurally
constrained Pfam domains (in_pfam=1&has_pathogenic=1); or
proteins with the highest density of intolerant positions via per-protein queries
to /api/db/position/<uniprot_id>. All results are downloadable
in JSON or TSV format for reproducible downstream analysis.
Retrieving and constructing custom datasets through the API — a guide for non-programmers
Every panel on the MissenseDB results page is backed by a REST API endpoint.
The same data the interface displays can be retrieved directly using curl
from a terminal, or with requests in Python. Basic queries can be
reproduced by copying the provided commands directly, while TSV output can be
opened in standard spreadsheet and statistical software without additional parsing.
Beyond the results page, the scan endpoint enables proteome-wide filtered dataset
construction that is not available through the GUI at all.
The base URL for all API calls is
https://biosig.lab.uq.edu.au/missense_db/.
The examples below use TP53 (UniProt accession P04637) throughout.
Database query endpoints support tab-separated output where indicated by appending
?format=tsv, suitable for opening directly in Excel, R, or other
statistical software. The structure mapping and PDB download endpoints return JSON
and PDB format respectively and do not support TSV output.
Sequence feature tracks (AM / VESM / VESPA / mean / pLDDT)
The area tracks shown in the sequence feature viewer — one per predictor plus the
mean and pLDDT — correspond to the am_cal_load, vesm_cal_load,
vespa_cal_load, mean_cal_load, and plddt columns
in DB1 (the min-max *_load columns are returned alongside them). One row is returned per residue position. The same response also includes
the structural context columns (dssp_ss, proximal_ligand,
in_pfam, pfam_name) shown in the annotation tracks, and
the has_pathogenic and worst_category flags shown in the
dbSNP track.
Available structures and structure residue mapping
The mapping endpoint returns, for each UniProt residue position, the corresponding
author residue number in that structure — this is what the GUI uses to synchronise
the sequence track with the 3D viewer. The auth field gives the
structure residue number; dssp and prox give the
per-structure DSSP assignment and ligand proximity at that residue. Score-annotated
PDB files (Panel 6 below) use these same author residue numbers, so the mapping
response is the bridge between UniProt positions and structure coordinates.
Residue Details and Position Summary
Clicking a position in the GUI populates the Residue Details table (all 19
substitution scores for the selected predictor, each with its calibrated probability in
brackets) and the Position Summary strip (calibrated per-predictor averages, pLDDT,
structure residue number). Both come from the
single-position endpoint. The am_scores, vesm_scores,
and vespa_scores columns contain all 19 raw substitution scores in
ALT:score format, pipe-separated, and the am_cal_scores,
vesm_cal_scores and vespa_cal_scores columns contain the
corresponding calibrated scores in the same format. The am_cal_load,
vesm_cal_load, vespa_cal_load, mean_cal_load, and
plddt fields populate the Position Summary strip.
HUMSAVAR Variants table
The variants table lists all HUMSAVAR-annotated substitutions for the protein with
predictor scores, ACMG/AMP classification, population frequencies, and ClinVar data.
Key columns: variant_category (LP/P, LB/B, US),
am_load / vesm_load / vespa_load (position-level
residue mutational-sensitivity scores, min-max normalised) with their calibrated counterparts
am_cal_load / vesm_cal_load / vespa_cal_load /
mean_cal_load, gnomad_af / topmed_af /
thousandg_af (population frequencies), and clinvar_json
(full per-submission ClinVar records). The bracketed calibrated probabilities shown
alongside raw scores in the GUI are computed from the empirical binning calibration
described in the Empirical Score Calibration section. The API returns position-level
calibrated scores in the *_cal_load columns; per-substitution calibrated
scores are available from the single-position endpoint in the *_cal_scores columns.
Score-annotated PDB download
For each structure, MissenseDB maps predictor scores into the B-factor column,
producing one PDB file per predictor (AM, VESM, VESPA). The URL pattern is
/missense_db/<uniprot_id>/<pdb_stem>/<predictor>.
By default the B-factor column holds the calibrated residue score multiplied by 100
(0–100); the file is served as <pdb_stem>_calibrated.pdb.
Appending ?scale=minmax returns the corresponding file in which the
B-factor column holds the min-max normalised residue score instead.
Downloaded files can be opened in PyMOL, ChimeraX, or VMD and coloured by
B-factor to reproduce the MissenseDB score mapping. Residue numbers in the file
correspond to the auth values returned by the mapping endpoint above.
Genomic coordinate lookup
Maps GRCh38 nucleotide positions to UniProt residues. Accepts up to 5,000
coordinates per request. Setting enrich: true adds the calibrated DB1 residue
scores (*_cal_load), the min-max normalised scores (*_load, retained
for backward compatibility), pLDDT, DSSP, and ligand proximity for each mapped residue.
The browser page (/missense_db/gencord) displays and exports the calibrated scores only.
Append ?format=tsv for tabular output.
The strand field uses P for plus strand and
M for minus strand.
Proteome-wide filtered dataset construction (scan endpoint)
This functionality goes beyond the results page GUI and is the most powerful
query mode in MissenseDB. The scan endpoint filters all 10.7 million positions
across the proteome simultaneously by any combination of score threshold,
secondary structure class, Pfam domain membership, ligand proximity, and clinical
variant presence. Results are returned as paginated TSV for immediate download and
analysis. The example below retrieves all 335,158 positions that are highly
sensitive (mean calibrated score ≥ 0.8), inside a Pfam domain, and within 5 Å of a bound
ligand — a dataset relevant to structure-guided variant prioritisation that is not
retrievable from any per-protein or per-variant interface. Use offset=500,
offset=1000 etc. to retrieve subsequent pages; available filter
parameters are listed in the API Reference section.
API Reference
All DB-backed endpoints are available under /api/db/.
Responses are JSON by default. Append ?format=tsv to any endpoint
for tab-separated output suitable for command-line pipelines.
The API is open with no authentication required.
*_load) and calibrated (*_cal_load) per-position scores are returned. Score blobs (full 19-substitution JSON) are excluded
for bandwidth — use the single-position endpoint for those.
am_scores, vesm_scores, vespa_scores
as dicts (JSON) or flattened ALT:score pipe-separated pairs (TSV).
mean_cal_load descending when a calibrated filter is applied, and by mean_load otherwise. Default limit 500, maximum 5000.
| Parameter | Type | Description |
|---|---|---|
| min_cal_load | float | Minimum mean_cal_load, the mean calibrated residue score across the three predictors (0–1) |
| max_cal_load | float | Maximum mean_cal_load (0–1) |
| min_load | float | Minimum mean_load, the mean min-max normalised residue score (0–1); retained for backward compatibility |
| max_load | float | Maximum mean_load (0–1); retained for backward compatibility |
| dssp | string | DSSP secondary structure code: H, E, T, S, G, B, I (coil/loop positions are stored as NULL and are not selectable by this filter) |
| in_pfam | 0 or 1 | Filter to positions in (1) or outside (0) Pfam domains |
| has_pathogenic | 0 or 1 | Filter to positions with at least one LP/P variant |
| worst_category | string | LP/P, LB/B, or US |
| proximal_ligand | 0, 1 or 2 | 1 = ligand within 5Å; 0 = experimental structure present, no ligand within 5Å; 2 = AlphaFold only (no experimental structure) |
| limit | int | Maximum rows returned (default 500, max 5000) |
| offset | int | Pagination offset for retrieving additional results (default 0) |
| format | string | json (default) or tsv |
rs prefix.
LP/P, LB/B, or US.
Default limit 500, maximum 50,000. Use offset to paginate through
larger result sets.
Uniprot | Pos | Ref | AM | VESM | VESPA.
Retained for backwards compatibility.
coords array (max 5,000).
Optionally enriches each hit with db1 residue scores (calibrated *_cal_load
and min-max *_load), pLDDT, DSSP and ligand proximity when
enrich: true is set. Append ?format=tsv for TSV output.
A browser-based interface that gives only calibrated values is available at
/gencord.
Database Schemas
DB1 — Position Summary
One row per (UniProt ID, position). ~10.7 million rows covering all 19,436 proteins.
| Field | Type | Description |
|---|---|---|
| uniprot_id | TEXT | UniProtKB/Swiss-Prot accession |
| position | INTEGER | 1-based residue position in UniProt sequence |
| ref_aa | TEXT | Reference amino acid (single letter) |
| am_load | REAL | AlphaMissense residue mutational-sensitivity score: mean of the 19 substitution-level scores, min-max normalised (0–1) |
| vesm_load | REAL | VESM-3B residue mutational-sensitivity score: mean of the 19 substitution-level scores, min-max normalised (0–1) |
| vespa_load | REAL | VESPA residue mutational-sensitivity score: mean of the 19 substitution-level scores, min-max normalised (0–1) |
| mean_load | REAL | Mean of available min-max normalised predictor scores (0–1, higher = more pathogenic). The normalised threshold of 0.5 represents the midpoint of each predictor's observed score range and is not a calibrated pathogenicity decision boundary. |
| am_scores | TEXT | JSON object mapping each alt amino acid to raw AM score e.g. {"A":0.99,...} |
| vesm_scores | TEXT | JSON object mapping each alt amino acid to raw VESM score |
| vespa_scores | TEXT | JSON object mapping each alt amino acid to raw VESPA score |
| n_structures | INTEGER | Number of PDB/AlphaFold structures covering this position |
| dssp_ss | TEXT | Modal DSSP secondary-structure assignment (H/E/T/S/G/B/I) among the structures that assign a class at this position; ties are broken by order of file processing. NULL indicates coil/loop (no class assigned in any mapped structure) or no coordinates at this position; use n_structures to distinguish them (>0 = coil/loop, 0 = no structural coverage). AlphaFold pLDDT confidence was not used to filter DSSP assignments. |
| proximal_ligand | INTEGER | 0 = experimental structure present, no ligand within 5Å; 1 = ligand present within 5Å; 2 = AlphaFold only, no experimental structure available |
| proximal_ligand_ids | TEXT | Comma-separated union of all proximal ligand names across structures |
| in_pfam | INTEGER | 1 if position falls within a Pfam domain interval |
| pfam_acc | TEXT | Pfam domain accession (e.g. PF00870) |
| pfam_name | TEXT | Pfam domain name (e.g. P53) |
| n_dbsnp | INTEGER | Number of rsIDs annotated at this position in HUMSAVAR |
| worst_category | TEXT | Most severe ACMG/AMP category at this position (LP/P > US > LB/B) |
| has_pathogenic | INTEGER | 1 if any substitution at this position is classified LP/P |
| plddt | REAL | AlphaFold per-residue pLDDT confidence score (0–100); NULL if no AlphaFold structure covers this position |
| structure_list | TEXT | Pipe-delimited list of mapping TSV filenames contributing annotations at this position; filenames with AF- prefix derive from AlphaFold models, all others from experimental PDB structures |
| am_cal_load | REAL | AlphaMissense residue score on the calibrated scale: mean of the 19 calibrated substitution-level scores (0–1) |
| vesm_cal_load | REAL | VESM-3B residue score on the calibrated scale: mean of the 19 calibrated substitution-level scores (0–1) |
| vespa_cal_load | REAL | VESPA residue score on the calibrated scale: mean of the 19 calibrated substitution-level scores (0–1) |
| mean_cal_load | REAL | Mean calibrated residue score across available predictors (0–1) |
| am_cal_scores | TEXT | JSON object mapping each alt amino acid to its calibrated AM score |
| vesm_cal_scores | TEXT | JSON object mapping each alt amino acid to its calibrated VESM-3B score |
| vespa_cal_scores | TEXT | JSON object mapping each alt amino acid to its calibrated VESPA score |
DB2 — HUMSAVAR + dbSNP
One row per annotated variant (UniProt ID, position, alt) with a matched dbSNP record. ~64,800 rows.
| Field | Type | Description |
|---|---|---|
| uniprot_id | TEXT | UniProtKB/Swiss-Prot accession |
| position | INTEGER | 1-based residue position |
| ref | TEXT | Reference amino acid |
| alt | TEXT | Alternate amino acid |
| gene_name | TEXT | HGNC gene symbol |
| ft_id | TEXT | UniProt feature identifier (VAR_XXXXXX) |
| variant_category | TEXT | ACMG/AMP classification: LP/P, LB/B, or US |
| disease_name | TEXT | Associated disease name from HUMSAVAR |
| dbsnp | TEXT | dbSNP rsID (e.g. rs121912662) |
| am_load | REAL | AlphaMissense residue mutational-sensitivity score at this position (min-max normalised) |
| vesm_load | REAL | VESM-3B residue mutational-sensitivity score at this position (min-max normalised) |
| vespa_load | REAL | VESPA residue mutational-sensitivity score at this position (min-max normalised) |
| mean_load | REAL | Mean min-max normalised residue score at this position across available predictors |
| gnomad_af | REAL | gnomAD genomes v4 allele frequency |
| gnomad_ac | INTEGER | gnomAD allele count |
| gnomad_tc | INTEGER | gnomAD total allele count |
| topmed_af | REAL | TOPMed allele frequency |
| topmed_ac | INTEGER | TOPMed allele count |
| topmed_tc | INTEGER | TOPMed total allele count |
| thousandg_af | REAL | 1000 Genomes allele frequency |
| tommo_af | REAL | ToMMo Japanese population allele frequency |
| clinvar_significance | TEXT | Pipe-separated ClinVar significance terms across all submissions |
| clinvar_diseases | TEXT | Pipe-separated disease names from ClinVar submissions |
| review_status | TEXT | Pipe-separated ClinVar review statuses |
| consequence | TEXT | Sequence ontology consequence from MANE-select transcript |
| mane_hgvs_c | TEXT | Coding HGVS notation from MANE-select transcript |
| mane_hgvs_p | TEXT | Protein HGVS notation from MANE-select transcript |
| dbgap_af | REAL | dbGaP population allele frequency |
| clinvar_json | TEXT | JSON array of per-submission ClinVar records, each containing accession, significance, disease names, review status, and last evaluated date |
| am_cal_load | REAL | AlphaMissense residue score at this position on the calibrated scale (0–1) |
| vesm_cal_load | REAL | VESM-3B residue score at this position on the calibrated scale (0–1) |
| vespa_cal_load | REAL | VESPA residue score at this position on the calibrated scale (0–1) |
| mean_cal_load | REAL | Mean calibrated residue score at this position across available predictors (0–1) |
Empirical Score Calibration
In the Residue Details and dbSNP Variants tables on the results page, each predictor score is shown
on its native scale alongside a bracketed calibrated probability: for example,
0.821 [0.74] for AlphaMissense or −9.83 [0.91] for VESM-3B.
The bracketed value is derived from an empirical binning calibration computed over
the 53,923 LP/P and LB/B HUMSAVAR 2026_01 missense variants with complete
per-substitution scores across all three predictors. Each predictor's raw score range
is divided into 200 equal-width bins; the empirical P(pathogenic | bin) is computed
from the LP/P and LB/B labels pooled over a sliding window of five adjacent bins, and a reverse-Bayes prior correction
is applied to factor out the HUMSAVAR dataset class balance
(π = 0.4005 = 21,597 / 53,923), yielding a calibrated posterior probability
interpretable at a 50:50 reference prior. This correction follows the approach
described in Malhis (2025, bioRxiv 2024.12.18.629275). Bins containing fewer than
five labelled calibration variants (LP/P or LB/B) in the pooled window are treated as unsupported and
assigned by linear interpolation from neighbouring supported bins.
The raw-score threshold corresponding to a calibrated probability of 0.5 is
0.29 for AlphaMissense, −8.04 for VESM-3B (log-likelihood ratio), and 0.45
for VESPA, demonstrating that the three predictors do not share a common decision
boundary on their native scales.
The same calibration is applied to each of the 19 possible substitutions at a position
before averaging. The resulting calibrated residue scores (*_cal_load in the
database) are used for the Position Summary strip, the sequence feature tracks, the structure
colouring and the calibrated B-factor PDB files.
Note: The calibrated values shown in brackets are derived from HUMSAVAR 2026_01 and may change if variant classifications are revised or new variants are added in future HUMSAVAR releases. They are provided as a contextual reference alongside the raw predictor scores, which remain available unchanged. No pathogenicity conclusion should be drawn from the calibrated value alone.
Licence
Contact:
Ashar J. Malik
ashar.malik@uq.edu.au
BioSig Lab · The University of Queensland